Niners test 8K cameras for replays at Levi’s Stadium

When fans are allowed back into Levi’s Stadium, they will be able to see some replays in the highest definition ever, thanks to an experiment that uses 8K camera technology to zoom in like never before.

Born out of a partnership between the San Francisco 49ers and Foxconn Industrial Internet (Fii), the team has mounted five of Fii’s 8K cameras inside the stadium to provide extremely high-definition views of both end zones, as well as an “all-22” look at the entire field. Because the 8K technology provides such a high level of resolution, the Niners have been able to show replays on the stadium’s big screens that can zoom in extremely close, all the better to help resolve the outcome of game action.


(8K-enabled replay of a touchdown play during the recent game between the Los Angeles Rams and the San Francisco 49ers at Levi’s Stadium. Credit: San Francisco 49ers)

While fans may enjoy the enhanced clarity, the main motivation behind the deployment was “to help the team win on the field,” said Aron Kennedy, vice president for game day production and broadcast operations for the Niners. While display and camera geeks can dive into the numbers behind what an 8K camera brings to the game, the simple explanation is that with much higher resolution, an 8K camera can provide the ability to zoom far deeper into a replay, bringing the kind of clarity that can help tell without a doubt whether a player’s toe has touched in-bounds or not, or whether a ball has “broken the plane” of the goal line.

According to Kennedy, the 8K cameras — one directly mounted pointing down each side of each goal line, plus the all-22 all-field cam — allow operators to zoom in as much as 400 percent while still providing an HD feed to the main scoreboards, the highest resolution those displays can show.

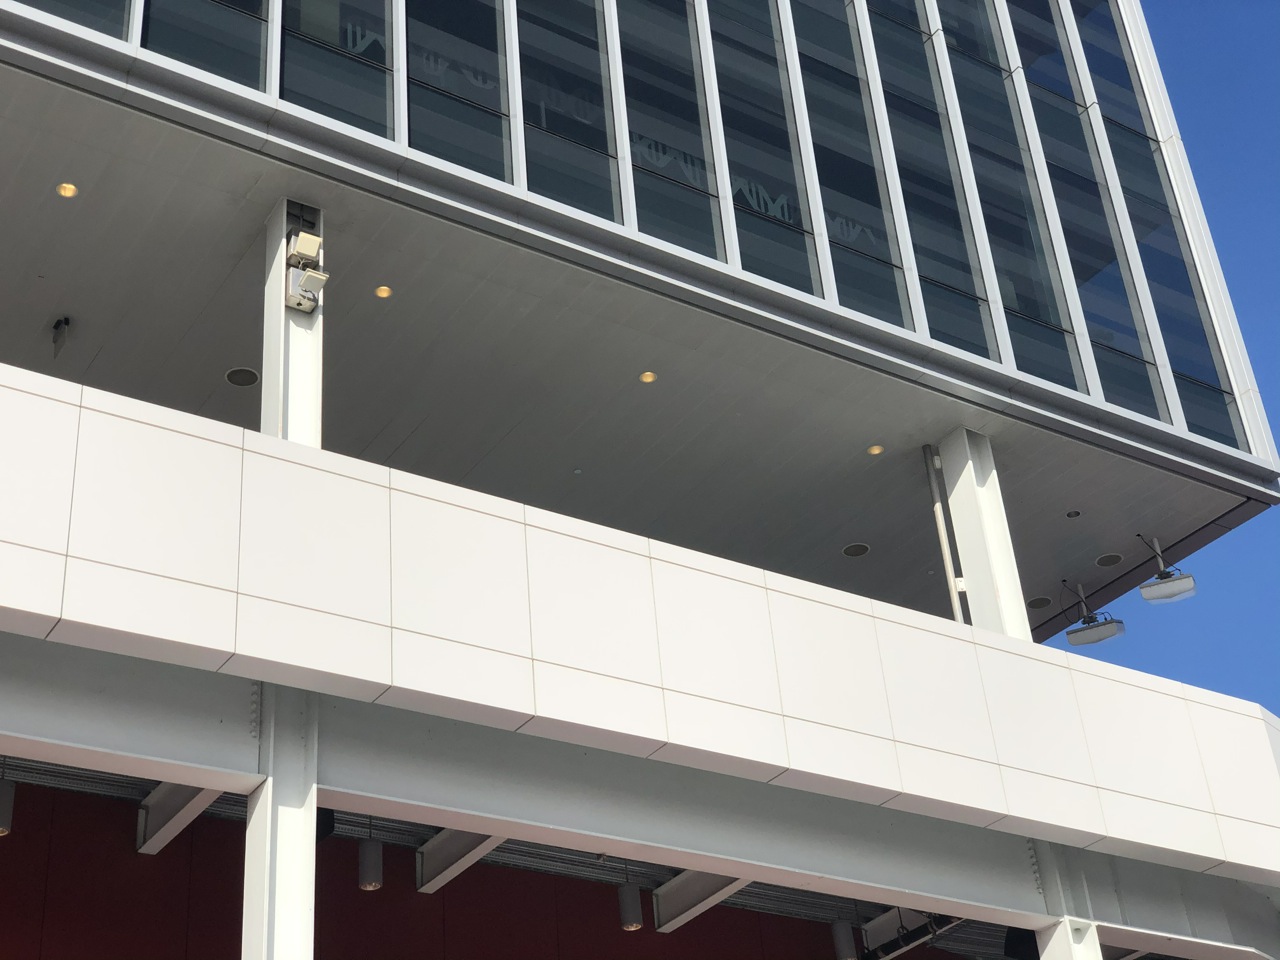
An 8K camera mounted inside Levi’s Stadium. Credit all photos: San Francisco 49ers (click on picture for a larger image)

Since the Niners can show the replays quickly on the big boards, Kennedy said the technology provides a sort of quick monitor to the team’s coaches, who can then decide whether or not they want to challenge a call. In a recent game against the Green Bay Packers, an 8K-enhanced replay led to a challenge call that overturned the referee’s original decision. In a big game, even having little edges like that could make the difference, Kennedy said.

Overall, just having a team that not only supports but encourages testing new technology makes being at Levi’s Stadium a fun place for employees like Kennedy, an 18-year veteran of the NFL who is now in his seventh year with the Niners.

“It says a lot about the organization, that they always want to push the envelope,” said Kennedy. “We like to lead the edge.”


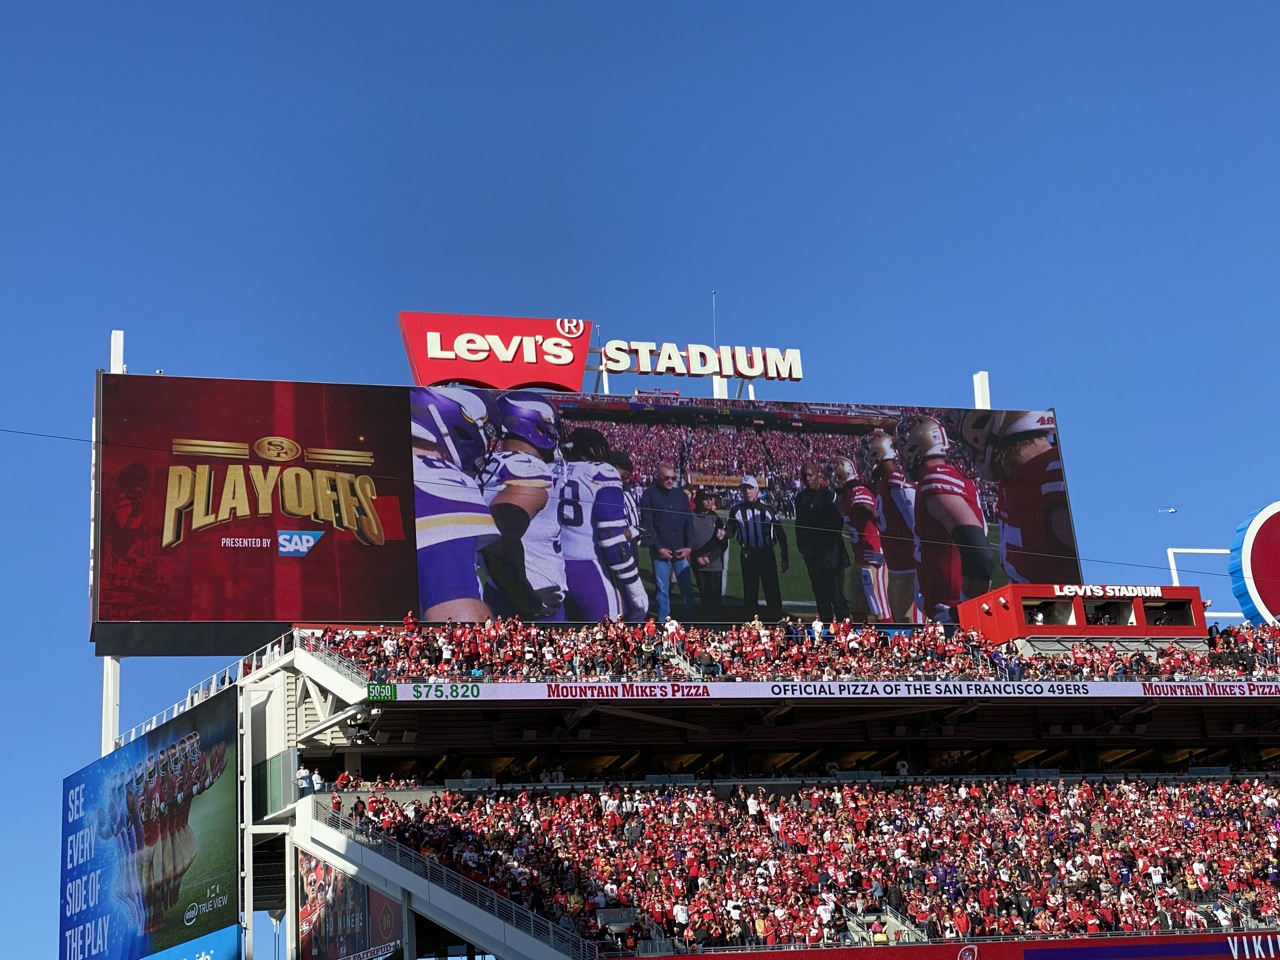
One of the Levi’s Stadium video boards showing an 8K replay

Super Bowl LIV sets new Wi-Fi record with 26.42 TB of data used

Under-seat Wi-Fi (left) and DAS (right) enclosures at Miami’s Hard Rock Stadium. Credit: Extreme Networks

The big game is back on top of the unofficial Mobile Sports Report single-day Wi-Fi rankings, with a mark of 26.42 terabytes of data used at last Sunday’s Super Bowl LIV in Miami, according to figures reported by Extreme Networks.

What’s most interesting (to us) about the number is that it was generated in a venue that had approximately 8,000 fewer fans in attendance than last year’s Super Bowl (70,081 in Atlanta for Super Bowl 53 vs. 62,417 for Super Bowl 54). So not surprisingly the fans who connected to the Wi-Fi network at Miami’s Hard Rock Stadium (which uses Extreme gear) also set a new record for average data consumed per connected user, at 595.6 megabytes per user — a big jump from last year’s average data per user total of 492.3 MB.

With a reported 44,358 unique devices connected to the network this year’s Super Bowl also set a new mark for Super Bowl take rate at 71 percent; the top overall take rate mark still belongs to Ohio State, which saw 71.5 of its fans connected when Ohio Stadium saw 25.6 TB of Wi-Fi used this fall during a game against Michigan State. It’s worth noting that the average data per user mark from the Ohio State game was 341.6 MB. Going forward, we think this statistic is even more important than the overall data-used or total tonnage mark, since it more accurately reflects how the network is performing for fans. But we also like keeping a record of the biggest totals as well, since it does provide a high-water mark for stadium Wi-Fi usage.

Peak network usage hits 10 Gbps

Some more info from the great list put together by Extreme: The peak concurrent user number of 24,837 devices was seen during pre-game activities; the peak network throughput of 10.4 Gbps also occurred before the game started, according to Extreme. Of the final data total, 11.1 TB was used before the game started, with the balance of 15.32 TB being used after kickoff.

The most used streaming apps by fans were, in order of usage, Apple iTunes, Apple Streaming, YouTube, Spotify and Netflix; the most used social apps in order of usage were Facebook, Instagram, Twitter, Snapchat and Bitmoji. For sports apps, the most used in order of usage were ESPN, NFL, NFL OnePass, CBS Sports and ESPN Go.

According to Extreme, the Wi-Fi setup at Hard Rock Stadium uses some 2,000 APs, many of which are deployed in under-seat enclosures in the bowl seating. For Super Bowl LIV Verizon customers also had access to an automatic login feature, which in many other stadiums (including Ohio State and Mercedes-Benz Stadium in Atlanta) has accounted for a significant amount of the connected Wi-Fi users.

THE MSR TOP 40 FOR WI-FI

1. Super Bowl 54, Hard Rock Stadium, Miami, Fla., Feb. 2, 2020: Wi-Fi: 26.42 TB
2. Michigan State vs. Ohio State, Ohio Stadium, Columbus, Ohio, Oct. 5, 2019: Wi-Fi: 25.6 TB
3. Super Bowl 53, Mercedes-Benz Stadium, Atlanta, Ga., Feb. 3, 2019: Wi-Fi: 24.05 TB
4. Penn State vs. Ohio State, Ohio Stadium, Columbus, Ohio, Nov. 23, 2019: Wi-Fi: 20.7 TB
5. NCAA Men’s 2019 Final Four semifinals, U.S. Bank Stadium, Minneapolis, Minn., April 6, 2019: Wi-Fi: 17.8 TB
6. Wisconsin vs. Ohio State, Ohio Stadium, Columbus, Ohio, Oct. 25, 2019: Wi-Fi: 17.0 TB
7. Super Bowl 52, U.S. Bank Stadium, Minneapolis, Minn., Feb. 4, 2018: Wi-Fi: 16.31 TB
8. Maryland vs. Ohio State, Ohio Stadium, Columbus, Ohio, Nov. 9, 2019: Wi-Fi: 16.1 TB
9. Miami (Ohio) vs. Ohio State, Ohio Stadium, Columbus, Ohio, Sept. 21, 2019: Wi-Fi: 13.7 TB
10. NCAA Men’s 2019 Final Four championship, U.S. Bank Stadium, Minneapolis, Minn., April 8, 2019: Wi-Fi: 13.4 TB
11. Florida Atlantic vs. Ohio State, Ohio Stadium, Columbus, Ohio, Aug. 31, 2019: Wi-Fi: 13.3 TB
12. Cincinnati vs. Ohio State, Ohio Stadium, Columbus, Ohio, Sept. 7, 2019: Wi-Fi: 12.7 TB
13. Garth Brooks Stadium Tour, Empower Field at Mile High, Denver, Colo., June 8, 2019: Wi-Fi: 12.63 TB
14. 2018 College Football Playoff Championship, Alabama vs. Georgia, Mercedes-Benz Stadium, Atlanta, Ga., Jan. 8, 2018: Wi-Fi: 12.0 TB
15. Auburn vs. Florida, Ben Hill Griffin Stadium, Gainesville, Fla., Oct. 5, 2019: Wi-Fi: 11.82 TB
16. Super Bowl 51, NRG Stadium, Houston, Feb. 5, 2017: Wi-Fi: 11.8 TB
17. Pittsburgh Steelers vs. New England Patriots, Gillette Stadium, Foxborough, Mass., Sept. 8, 2019: Wi-Fi: 11.58 TB
18. Ohio State vs. Nebraska, Memorial Stadium, Lincoln, Neb., Sept 28, 2019: Wi-Fi: 11.2 TB
19. Atlanta Falcons vs. Philadelphia Eagles, Lincoln Financial Field, Philadelphia, Pa., Sept. 6, 2018: Wi-Fi: 10.86 TB
20. 2020 College Football Playoff Championship, LSU vs. Clemson, Mercedes-Benz Superdome, New Orleans, La., Jan. 13, 2020: Wi-Fi: 10.12 TB
21. Super Bowl 50, Levi’s Stadium, Santa Clara, Calif., Feb. 7, 2016: Wi-Fi: 10.1 TB
22. Taylor Swift Reputation Tour, Gillette Stadium, Foxborough, Mass., July 27, 2018: Wi-Fi: 9.76 TB
23. Northwestern vs. Nebraska, Memorial Stadium, Lincoln, Neb., Oct. 5, 2019: Wi-Fi: 9.2 TB
24. Tennessee Titans vs. Denver Broncos, Empower Field at Mile High, Denver, Colo., Oct. 13, 2019: Wi-Fi: 8.98 TB
25. Minnesota Vikings vs. Philadelphia Eagles, NFC Championship Game, Lincoln Financial Field, Philadelphia, Pa., Jan. 21, 2018: Wi-Fi: 8.76 TB
26. Jacksonville Jaguars vs. New England Patriots, AFC Championship Game, Gillette Stadium, Foxborough, Mass., Jan. 21, 2018: Wi-Fi: 8.53 TB
27. Northern Illinois vs. Nebraska, Memorial Stadium, Lincoln, Neb., Sept. 14, 2019: Wi-Fi: 8.5 TB
28. Rolling Stones No Filter Tour, Empower Field at Mile High, Denver, Colo., Aug. 10, 2019: Wi-Fi: 8.47 TB
29. South Alabama vs. Nebraska, Memorial Stadium, Lincoln, Neb., Aug. 31, 2019: Wi-Fi: 8.3 TB
30. Taylor Swift Reputation Tour, Broncos Stadium at Mile High, May 25, 2018: Wi-Fi: 8.1 TB
31. Chicago Bears vs. Denver Broncos, Empower Field at Mile High, Denver, Colo., Sept. 15, 2019: Wi-Fi: 8.09 TB
32. Kansas City Chiefs vs. New England Patriots, Gillette Stadium, Foxborough, Mass., Sept. 7, 2017: Wi-Fi: 8.08 TB
33. SEC Championship Game, Alabama vs. Georgia, Mercedes-Benz Stadium, Atlanta, Ga., Dec. 1, 2018: Wi-Fi: 8.06 TB
34. Green Bay Packers vs. Dallas Cowboys, Divisional Playoffs, AT&T Stadium, Arlington, Texas, Jan. 15, 2017: Wi-Fi: 7.25 TB
35. Stanford vs. Notre Dame, Notre Dame Stadium, South Bend, Ind., Sept. 29, 2018: 7.19 TB
36. (tie) Southern California vs. Notre Dame, Notre Dame Stadium, South Bend, Ind., Oct. 21, 2017: 7.0 TB
Arkansas State vs. Nebraska, Memorial Stadium, Lincoln, Neb., Sept 2, 2017: Wi-Fi: 7.0 TB
37. Tennessee vs. Florida, Ben Hill Griffin Stadium, Gainesville, Fla., Sept. 21, 2019: Wi-Fi: 6.94 TB
38. WrestleMania 32, AT&T Stadium, Arlington, Texas, April 3, 2016: Wi-Fi: 6.77 TB
39. Wisconsin vs. Nebraska, Memorial Stadium, Lincoln, Neb., Oct. 7, 2017: Wi-Fi: 6.3 TB
40. Super Bowl 49, University of Phoenix Stadium, Glendale, Ariz., Feb. 1, 2015: Wi-Fi: 6.23 TB

Levi’s Stadium sees its second-highest Wi-Fi mark with nearly 6 TB at Niners-Vikings playoff game

The video board shows team captains assembling before kickoff at last week’s playoff game between the Vikings and Niners at Levi’s Stadium. Credit: Brian Nitenson, MSR (click on any picture for a larger image)

The first NFL playoff game at Levi’s Stadium last Sunday saw the second-highest Wi-Fi data usage mark for the venue, with 5.95 terabytes used, according to figures provided by the San Francisco 49ers.

While that mark may eventually be eclipsed at this weekend’s NFL Championship game against the visiting Green Bay Packers, the packed house of 71,649 fans who witnessed the Niners’ 27-10 victory over the visiting Minnesota Vikings spent a lot of time using the stadium’s Wi-Fi network, with 21,195 unique connections recorded by the Niners. The peak concurrent connection number was 15,075, according to the Niners.

Of all the big events at Levi’s Stadium since its opening in 2014, only Super Bowl 50 on Feb. 7, 2016, saw more Wi-Fi used by fans, with 10.1 TB used that day. Last January, a crowd of 74,814 attending the college football playoff championship game between Alabama and Clemson used 5.1 TB of Wi-Fi data, the previous No. 2 mark at Levi’s. Other big-event totals included 4.5 TB used during Wrestlemania 31 on March 29, 2015 (with 76,976 fans in attendance).

DAS also strong

Speedtest of the DAS network during Sunday’s game. Credit: Keith Newman, MSR

While Levi’s Stadium still has the original number of approximately 1,300 Aruba Wi-Fi APs as the opening-day design, the cellular distributed antenna network (DAS) has undergone additions and improvements almost since the venue opened, including a significant upgrade from Verizon ahead of Super Bowl 50. Though we don’t have an exact count yet of the total of DAS antennas in the stadium, from visits over the past few years MSR has seen more DAS antennas each time we’ve visited, no surprise since the bandwidth demands from fans continue to increase.

MSR contributing editor Keith Newman was at Sunday’s game and got strong DAS speed tests on the main concourse and on the stadium’s top levels, in the 30 Mbps range each time. On the press box level on Levi’s Stadium’s west side, he got a mark of 116 Mbps on the download and 33.2 Mbps on the upload.

Below, some more photos from our field team at Sunday’s game. If you are at the championship game this week, send us some pix and speedtests!

Wi-Fi and DAS antennas visible on the stadium structures. Credit: Keith Newman, MSR

Niners fans getting their tailgate on before the game. Credit: Brian Nitenson, MSR

VenueNext debuts new strategy, products at University of Florida

VenueNext powers a new app at the University of Florida’s Ben Hill Griffin Stadium, where it also debuted new products like a POS system and a web-based app. Credit all photos: Paul Kapustka, MSR (click on any picture for a larger image)

Created in 2014 to provide stadium apps for sports teams, VenueNext has pivoted toward focusing on mobile commerce services, a strategy that includes building web-based apps for teams, schools and other large public venues as well as for big events.

Though the company hasn’t completely given up on building team and stadium apps, executives at VenueNext pointed toward the company’s partnership with the University of Florida as a good example of its new strategic focus. In addition to providing the school with a stadium app that launched this fall, VenueNext also debuted its back-house point-of-sale transaction system at Florida, as well as a web-based app for stadium services and purchases. According to VenueNext executives, the new offerings are part of a new focus on mobile transactions, one that de-emphasizes the company’s former goal of providing full-service, custom-built apps with a wide range of features, including concessions ordering, instant replay video, venue wayfinding and loyalty programs.

Cailen Wachob, VenueNext’s executive vice president for sales, retention, marketing and operations, said “we’ve been pretty quiet about it” in regards to the company’s new offerings and strategies. Originally launched as the provider of the team and stadium app for the San Francisco 49ers and Levi’s Stadium, VenueNext raised $24 million in venture funding to fuel a push into what looked like a burgeoning market for team and stadium apps as venues became increasingly connected.

After an initial flurry of professional team customer wins, including other NFL teams like the Minnesota Vikings, NBA teams including the Orlando Magic, Minnesota Timberwolves, Charlotte Hornets and Utah Jazz, and the NHL’s San Jose Sharks, VenueNext did not have any big-name announcements in the past year. In mid-2018, VenueNext founding CEO John Paul was replaced by Anthony Perez, former chief marketing officer for the Orlando Magic, a point at which the company “took a step back to look at what we wanted to do, moving forward,” Wachob said.

An express pickup window for concession orders made on the Florida app.

What that turned into was a new focus more on helping teams, venues and events with mobile commerce activities, rather than a strict direction of just providing a do-everything app with bells and whistles like instant replay video. That combination proved alluring for Florida, which is VenueNext’s first big-college customer.

“We wanted to pick a lane and focus on that, rather than be a custom developer shop,” Wachob said. That means that while VenueNext will still build team apps, it may use third-party functionality as needed.

“We’re more focused on the venue commerce utility,” Wachob said. “We’re not going to be focused on building out things like replay and video.”

Tough market, lots of competition

Since VenueNext’s launch, the stadium and team app has gotten extremely competitive, with multiple players joining the game. Early market leader YinzCam remains the player with the most customers, but it has been joined by a list of providers that includes Venuetize, Hopscotch, Built.io and Rover.io as well as older apps from operations like CBS Interactive and Sidearm Sports. The problem all app providers face, however, is the lukewarm adoption of stadium apps by fans in general. While teams and venues all tout the idea of a stadium app as a way for fans to have a so-called “remote control” for their game-day visits, the reality is that most fans don’t download or use the apps widely, except when forced to for things like digital ticketing.

Screenshot of the web-app ordering system at Florida.

While teams and venues (and the app providers) may claim that fans use stadium apps, the reality is that actual statistics for fan app use are rarely ever provided. In the few instances where teams or venues do provide statistics for things like app usage at games, team and stadium apps fall far behind general-purpose mobile apps like social media apps, email and application updates.

In-venue transactions, however, do offer a way for teams and venues to lure fans to an app or web platform, either by requiring it (in the case of digital ticketing) or by making it an attractive feature, by supporting things like in-seat delivery, raffles and games, order-ahead concessions or in-venue “experience” purchases like seat upgrades or things like on-field tours, or meet-the-players gatherings.

VenueNext famously had an ambitious goal of providing in-seat concessions delivery services for all seating areas at Levi’s Stadium, but that program was shelved in 2017 after limited use and challenges in providing the service to 70,000-plus potential customers.

What has emerged in the market as a more manageable solution are less-ambitious programs like offering delivery to limited seating areas (usually premium club areas) or mobile order-ahead services with express window pickup. The app for Florida’s Ben Hill Griffin Stadium offers the latter, with several areas around the venue having pick-up windows set aside for the mobile orders.

POS, kiosk ordering and web-based apps

Wachob said that Florida was also the first live customer for VenueNext’s new POS software system, a product that puts VenueNext into competition with players like Oracle’s Micros and Appetize. The system supports 180 different stands at Ben Hill Griffin Stadium, which Wachob said had previously used a cash-drawer system. VenueNext’s website also now includes promotion of kiosk-based self-serve concession systems, a rapidly growing service in sports venues.

VenueNext also rolled out its first live web-based app for Florida, where fans can interact with venue services without having to download an app. Once an unthinkable move for a company devoted to apps, the new service even has its own name and website, ordernext.com, linked to the main VenueNext site. The ordernext platform at Florida provided a way for fans to simply click on a link that said “Water Me” to get cold water delivered to seats in the stadium’s sunny section. Wachob said the site also allowed fans to purchase in-venue experiences, like an on-field pass or a visit with the Gator mascots.

“The new app and POS technology makes concessions better for everyone, it’s faster for those who order ahead of time, and the lines are shorter,” said Scott Stricklin, Florida’s athletic director.

The ordernext platform puts VenueNext into direct competition with providers like Rover.io, which tout the fast performance and greater flexibility of a web approach as opposed to a standalone app. Notably, Rover lists the Vikings and the Hornets as customers, even though those teams also have a VenueNext app. Stadium tech integrator AmpThink helped launch a similar program a year ago at Texas A&M, where the 12thmanlive.com site provided quick links to contests, discounts and other game-day activities.

To VenueNext’s Wachob, not being religious about whether services are offered in an app or on the web is part of the company’s new focus on mobile commerce first.

“Sometimes fans at the venue might not want to download the app,” Wachob said. “The ability to just go to a site [for a transaction] is really powerful. That’s the power of mobile — allowing the fan to determine what’s important to them.”

Introducing: The VENUE DISPLAY REPORT!

Mobile Sports Report is pleased to announce our latest editorial endeavor, the VENUE DISPLAY REPORT!

A new vertical-specific offering of MSR’s existing STADIUM TECH REPORT series, the VENUE DISPLAY REPORT series will focus on telling the stories of successful venue display technology deployments and the business opportunities these deployments enable. No registration or email address required — just click on the image below and start reading!

Like its sibling Stadium Tech Report series, the Venue Display Report series will offer valuable information about cutting-edge deployments that venue owners and operators can use to inform their own plans for advanced digital-display strategies.

Our reporting and analysis will be similar to that found in our popular STR series, with stadium and venue visits to see the display technology in action, and interviews and analysis with thought leaders to help readers better inform their upcoming technology purchasing decisions. And in case you are new to the MSR world, rest assured that all our VDR reports will be editorially objective, done in the old-school way of real reporting. We do not accept paid content and do not pick profiles based on any sponsorship or advertising arrangements.

Our inaugural issue contains profiles of a new concourse display strategy at the San Jose Sharks’ SAP Center, powered by new LED screens from Daktronics and the Cisco Vision IPTV digital display management system; a look at the Utah Jazz’s decision to use Samsung’s system-on-a-chip displays at Vivint Smart Home Arena; and the San Francisco 49ers’ decision to use Cisco Vision to control displays at Levi’s Stadium.

Start reading the first issue now! No download or registration necessary.

As venues seek to improve fan engagement and increase sponsor activation, display technology offers powerful new ways to improve the in-stadium fan experience. While these topics are of prime interest to many of our long-term audience of stadium tech professionals, we suggest that you share the link with colleagues on the marketing and advertising sales side of the house, as they will likely find great interest in the ROI enabled by strategic display system deployments.

Sponsorship spots are currently available for future VDR series reports; please contact Paul at kaps at mobilesportsreport.com for media kit information.

Levi’s Stadium sees 5.1 TB of Wi-Fi data used at college football championship

Fans and media members at Monday night’s College Football Playoff championship game used a total of 5.1 terabytes of data on the Wi-Fi network at Levi’s Stadium, according to figures provided by the San Francisco 49ers, who own and run the venue.

With 74,814 in attendance for Clemson’s 44-16 victory over Alabama, 17,440 of those in the stands found their way onto the stadium’s Wi-Fi network. According to the Niners the peak concurrent connection number of 11,674 users was seen at 7:05 p.m. local time, which was probably right around the halftime break. The peak bandwidth rate of 3.81 Gbps, the Niners said, was seen at 5:15 p.m. local time, just after kickoff.

In a nice granular breakout, the Niners said about 4.24 TB of the Wi-Fi data was used by fans, while a bit more than 675 GB was used by the more than 925 media members in attendance. The Wi-Fi data totals were recorded during an 8-1/2 hour period on Monday, from 1 p.m. to 9:30 p.m. local time.

Added to the 3.7 TB of DAS traffic AT&T reported inside Levi’s Stadium Monday night, we’re up to 8.8 TB total wireless traffic so far, with reports from Verizon, Sprint and T-Mobile still not in. The top Wi-Fi number at Levi’s Stadium, for now, remains Super Bowl 50, which saw 10.1 TB of Wi-Fi traffic.

https://alhikamsurabaya.sch.id/wp-content/slot-thailand/

https://mtsnupakis.sch.id/wp-content/bonus-new-member/

https://smptagsby.sch.id/wp-content/slot-bet-200/

https://lookahindonesia.com/wp-content/bonus-new-member/

https://sd-mujahidin.sch.id/wp-content/depo25-bonus25/

https://ponpesalkhairattanjungselor.sch.id/wp-content/mahjong-slot/

https://mtsnupakis.sch.id/wp-content/slot777/

https://sdlabum.sch.id/wp-content/slot777/

https://sdlabumblitar.sch.id/wp-content/bonus-new-member/

https://sdlabumblitar.sch.id/wp-content/spaceman/

https://paudlabumblitar.sch.id/wp-content/spaceman/