U.S. Bank Stadium sees 31.2 TB of Wi-Fi data used during Final Four weekend

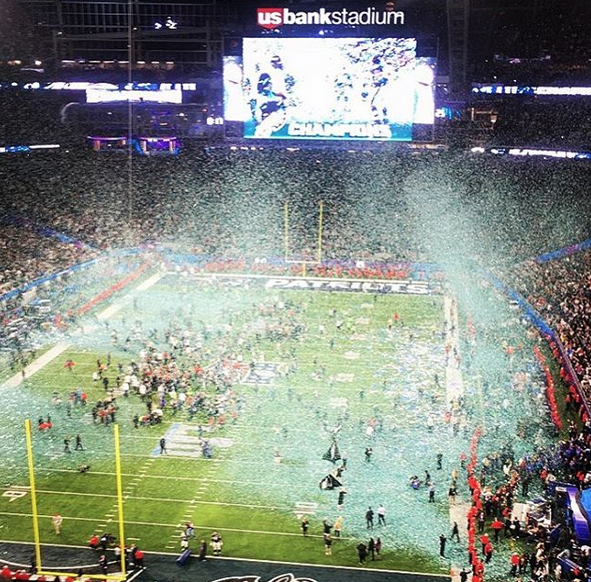
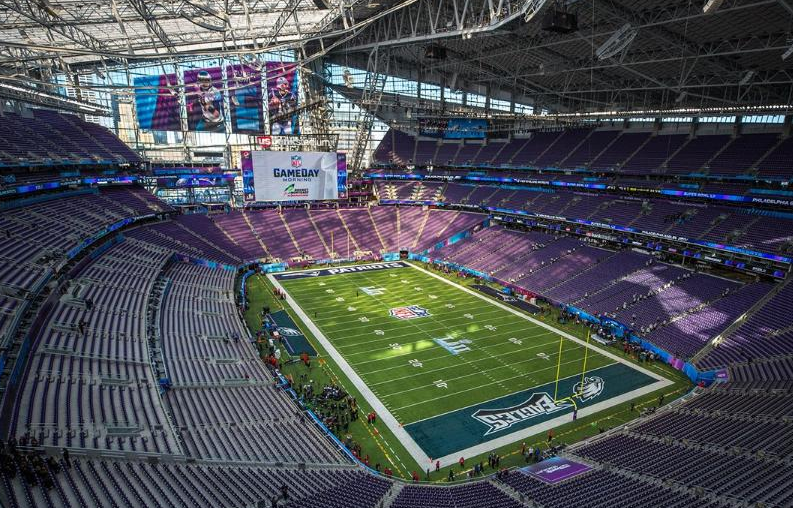
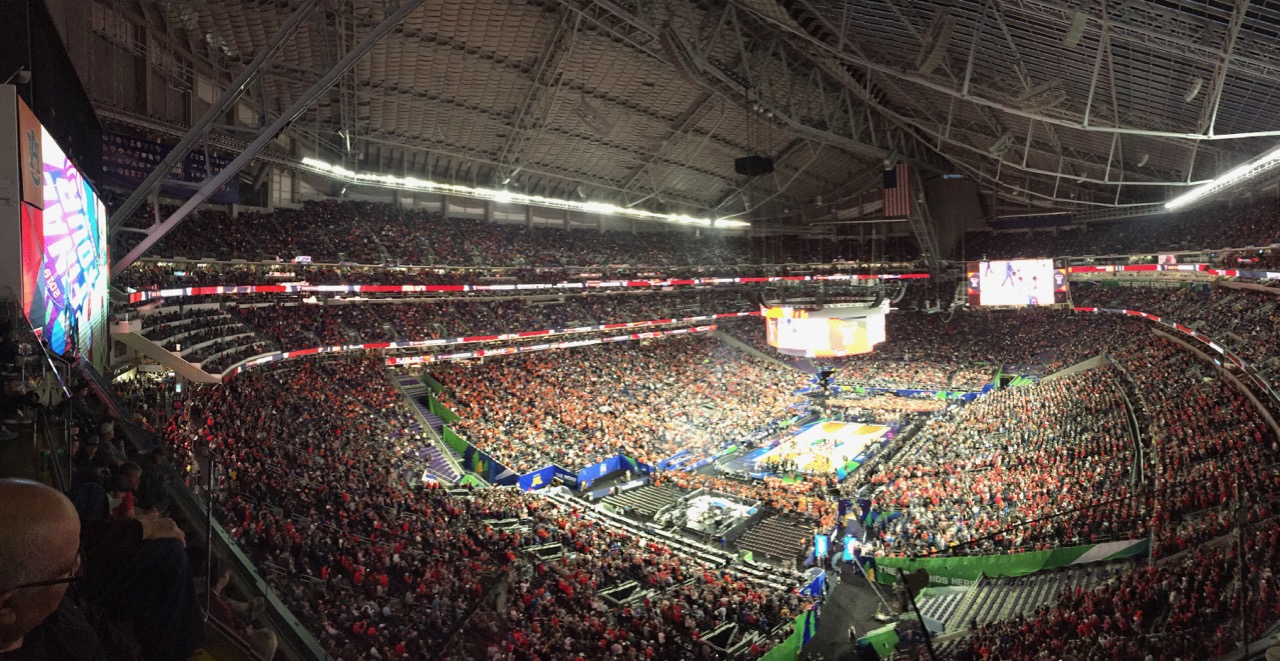
The Final Four generated record Wi-Fi totals this year at U.S. Bank Stadium in Minneapolis. Credit all photos: Paul Kapustka, MSR (click on any picture for a larger image)

Fans at this year’s NCAA Men’s Final Four basketball tournament at U.S. Bank Stadium in Minneapolis used more than 31 terabytes of data on the Wi-Fi network during the championship weekend, with stadium records set in total single-day Wi-Fi usage and sustained data rates, and overall records set for concurrent connections and unique connections, according to figures from the NCAA.

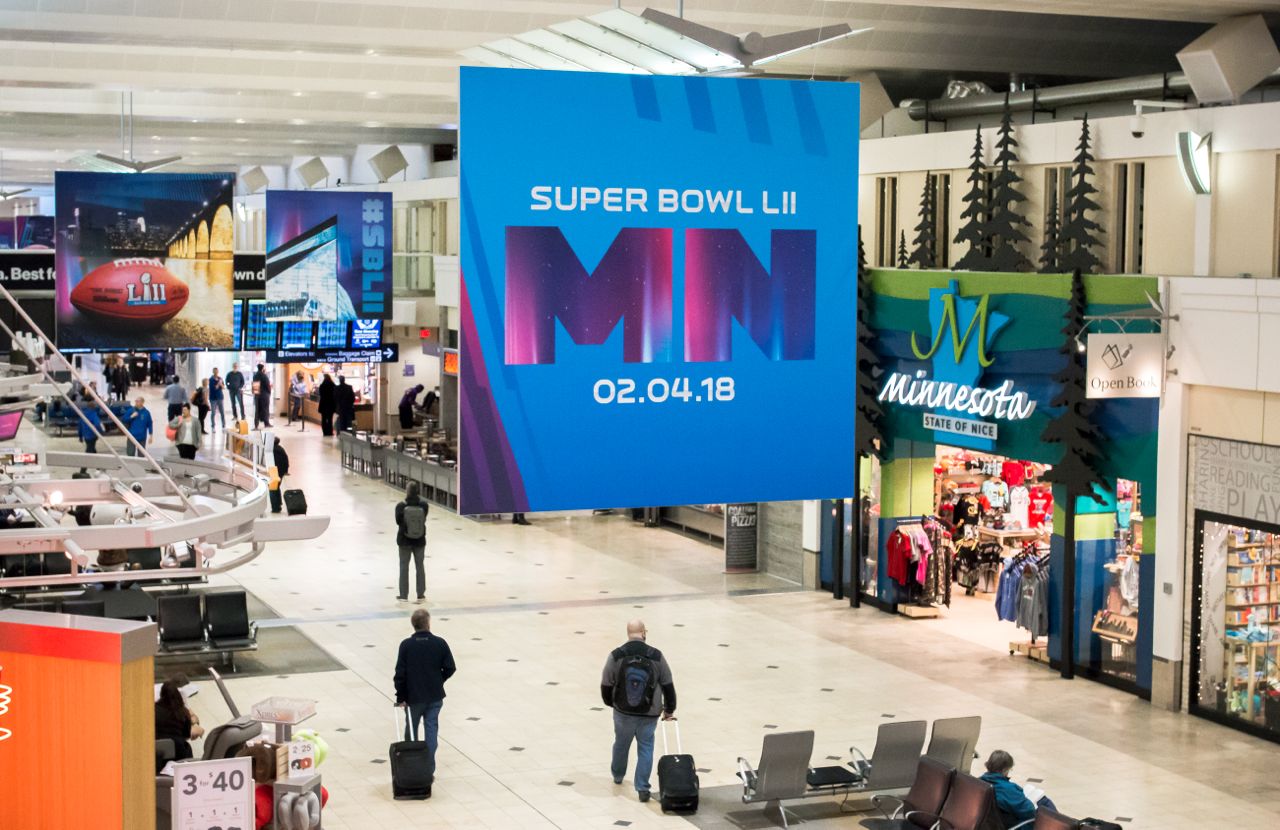
The semifinal matches on April 6 between Auburn and Virginia and Texas Tech and Michigan State saw fans use the second-highest single-day Wi-Fi total we have seen reported, with 17.8 TB of data used. The Wi-Fi total surpassed the 16.31 TB of Wi-Fi data used in the same stadium during Super Bowl 52 on Feb. 4, 2018; only Super Bowl 53 this year at Mercedes-Benz Stadium in Atlanta, with 24.05 TB of Wi-Fi used, has seen a bigger data day (according to our unofficial list of such data events).

According to the NCAA figures, the network saw 51,227 unique users on Final Four Saturday, out of 72,711 in attendance. The 70 percent take rate just beats the 69 percent take rate seen at Super Bowl 53, an overall sign perhaps that bucket-event fans are increasingly turning to stadium Wi-Fi for connectivity. At Super Bowl 52 in U.S. Bank Stadium, there were 40,033 unique users on the Wi-Fi network (out of 67,612 in attendance), a take rate of 59 percent.

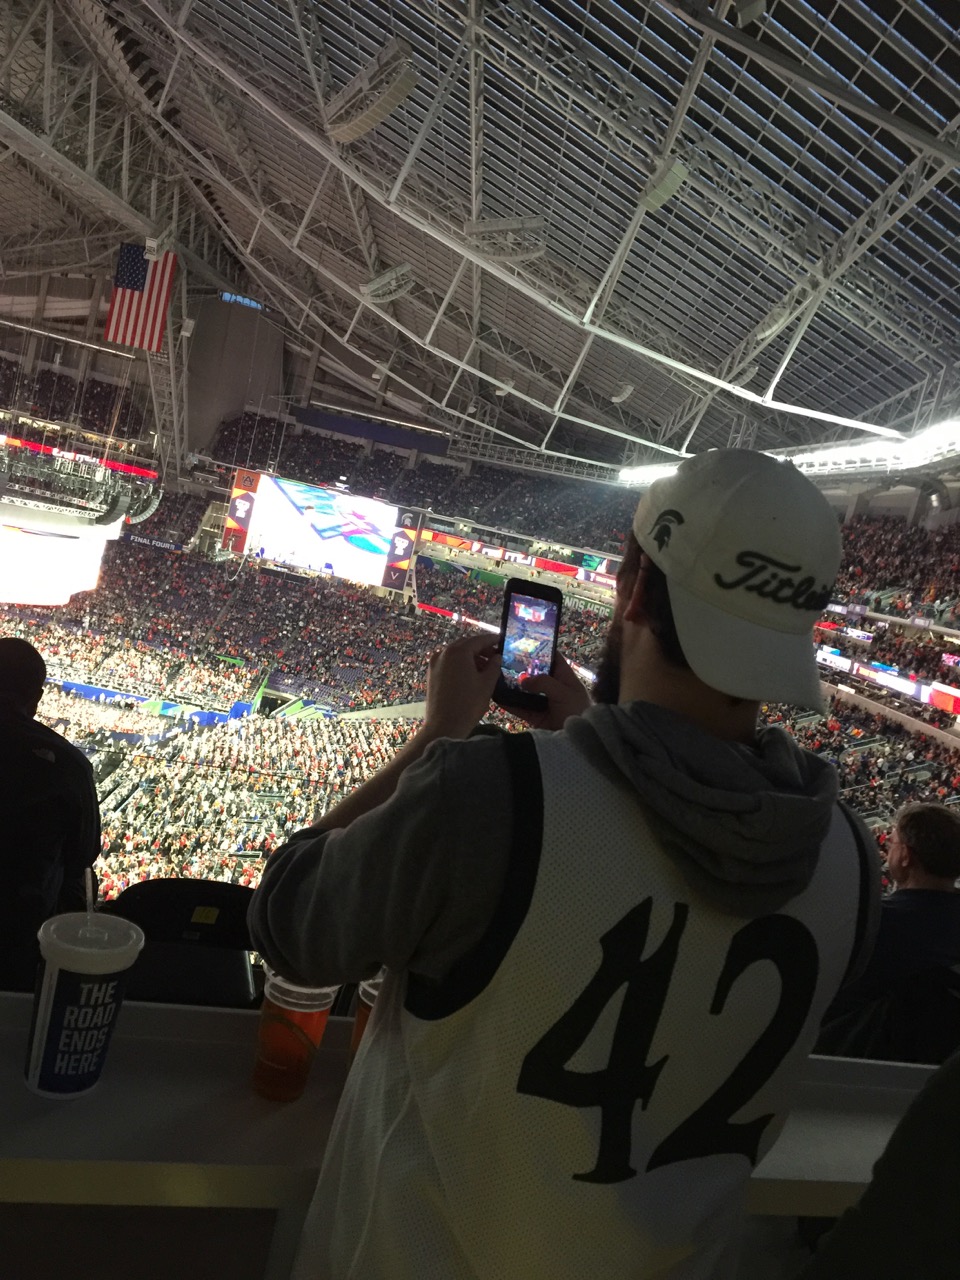
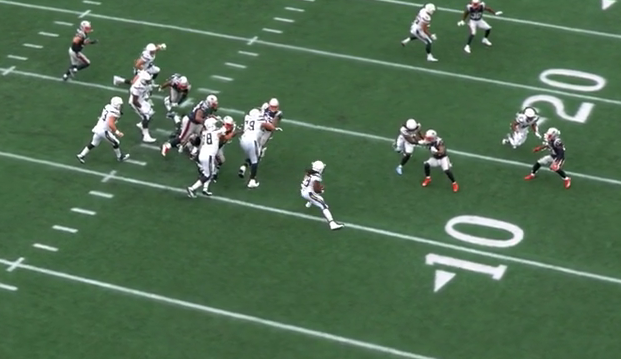
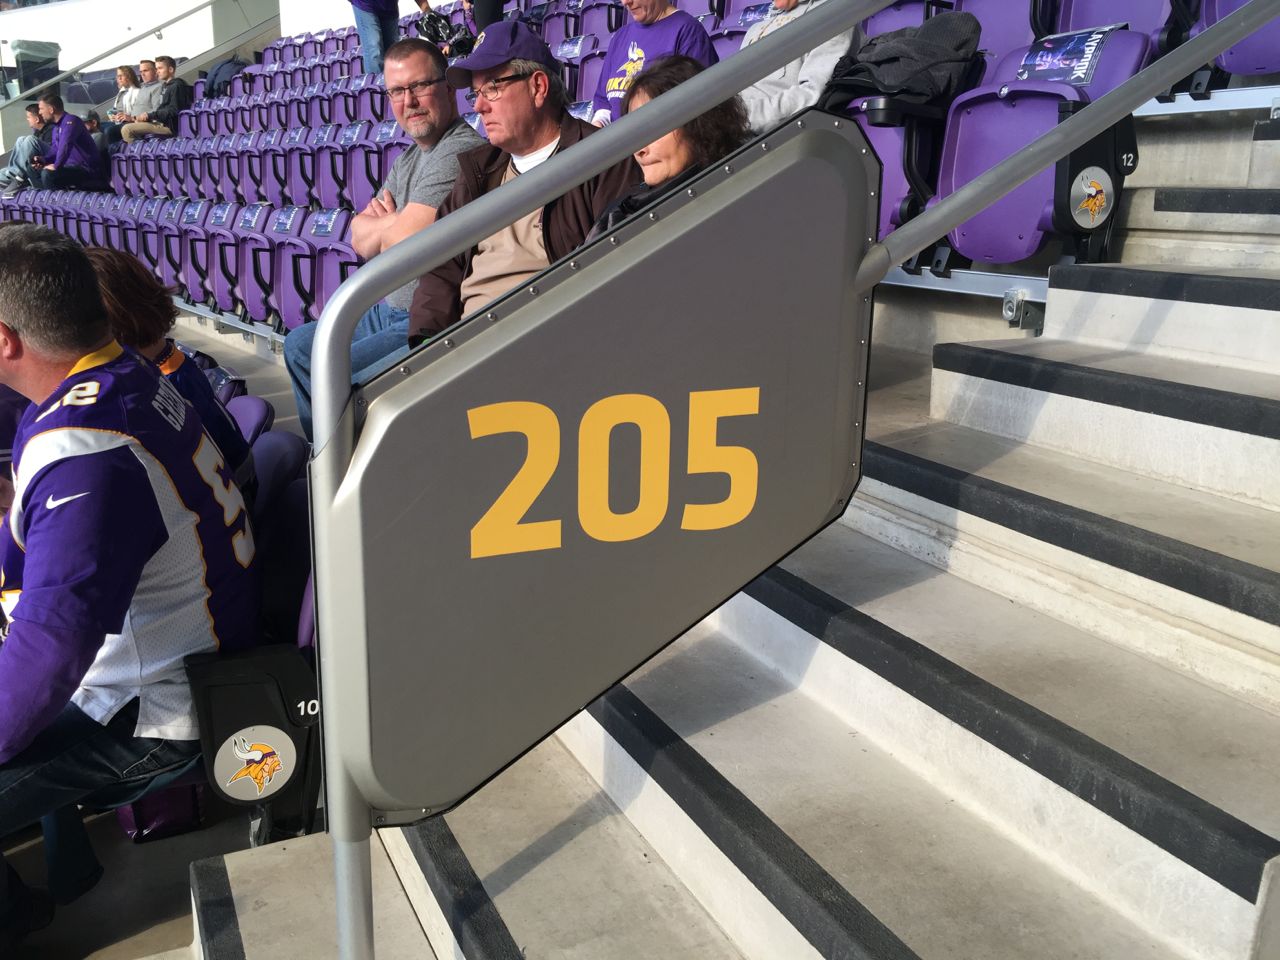
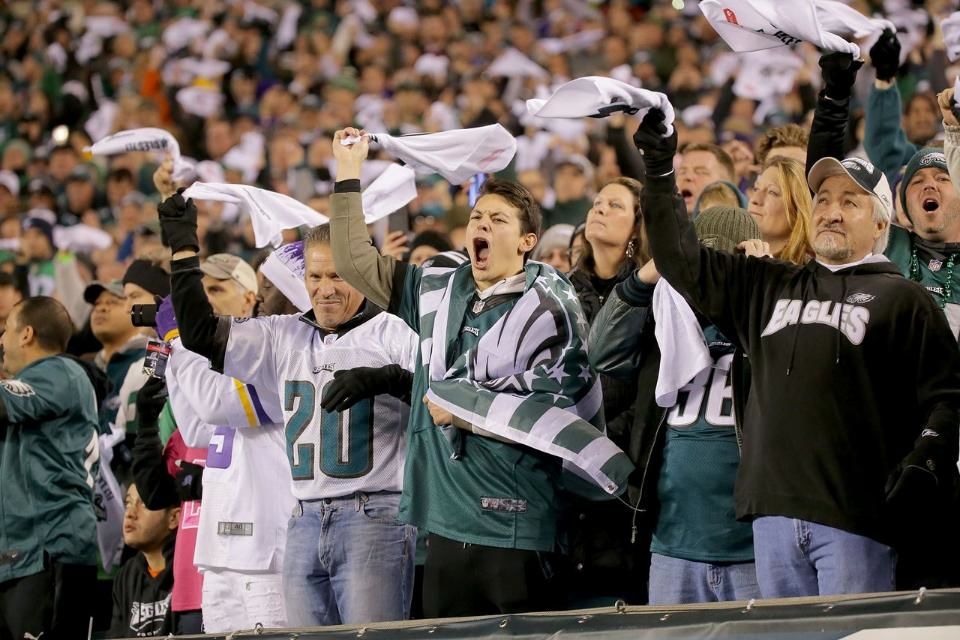
A familiar scene at the FInal Four — a fan recording their experience

The peak concurrent user number from Final Four Saturday of 31,141 was also an overall record, beating Super Bowl 53’s mark of 30,605. (Super Bowl 53 had 70,081 fans in attendance for the Feb. 3 game between the New England Patriots and the Los Angeles Rams.) The Wi-Fi network numbers for Monday’s championship game (won by Virginia 85-77 over Texas Tech in overtime) saw big numbers itself, with 13.4 TB of total data used, and 48,449 unique connections and 29,487 peak concurrent users (out of 72,062 in attendance). Monday’s game also produced a peak throughput number of 11.2 Gbps just after the game ended. The total official Wi-Fi data used during the semifinals and final was 31.2 TB.

According to stadium network officials, there were 1,414 active Cisco access points for the Final Four games, with some permanent Wi-Fi APs not being used because they were covered by the temporary seats that extended out to the court built in the middle of where the football field usually is. However, the temporary seating was covered by an additional 250 APs and 50-plus switches in a temporary network built by AmpThink and the stadium network team (look for a deeper profile of the temporary network in our upcoming Summer STADIUM TECH REPORT issue!).

Speed tests taken by Mobile Sports Report showed robust Wi-Fi connectivity all around the venue on both days, with marks like a 48.6 Mbps download and 44.0 Mbps upload in the higher seating section during pregame for Saturday’s events, another mark of 45.3 Mbps / 38.7 Mbps on the third-level main concourse close to Saturday’s tipoff, and a mark of 54.8 Mbps / 38.3 Mbps on the main lower-level concourse just after tipoff of Monday’s championship game.

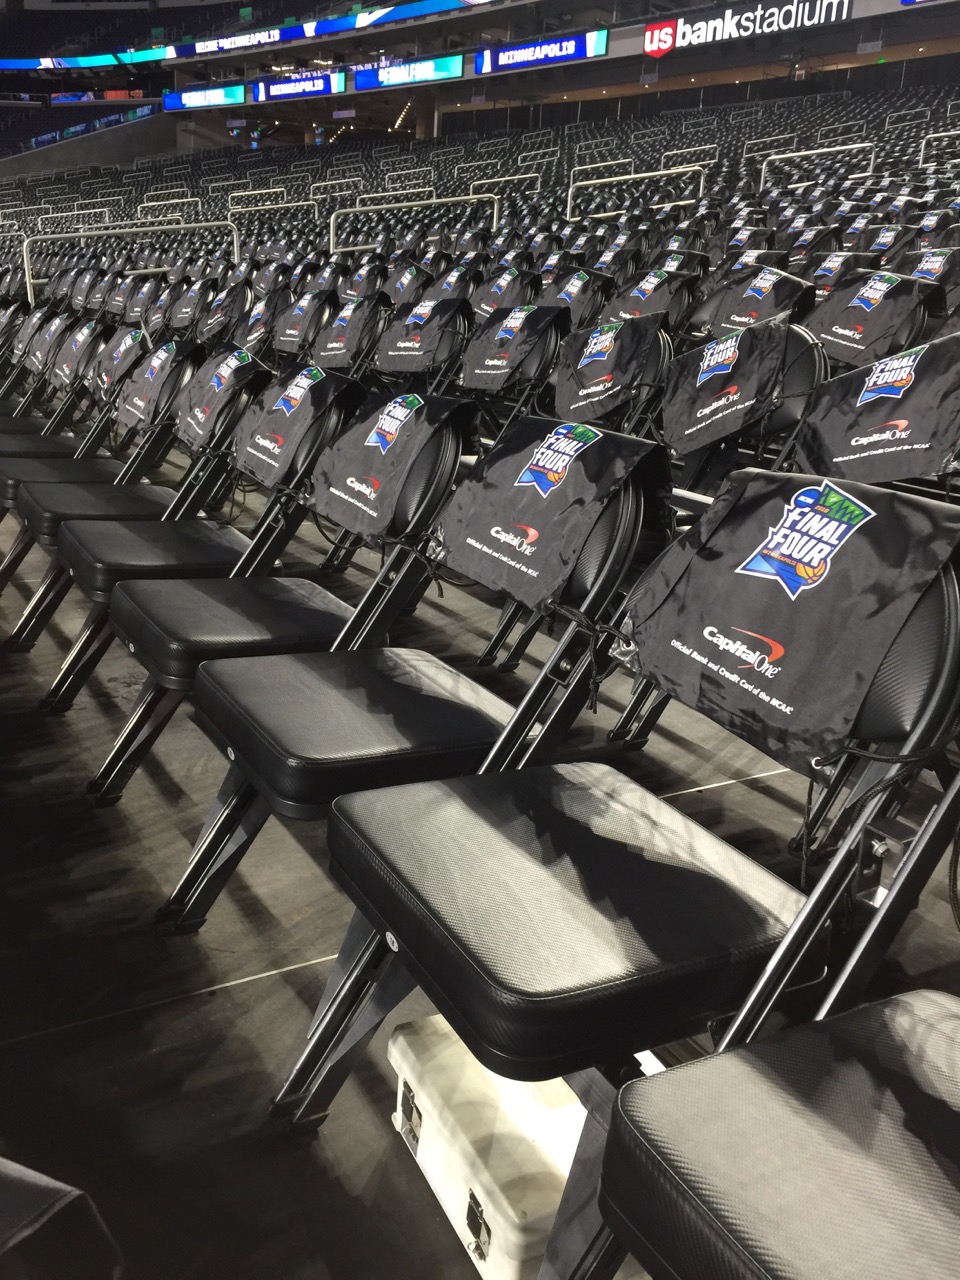
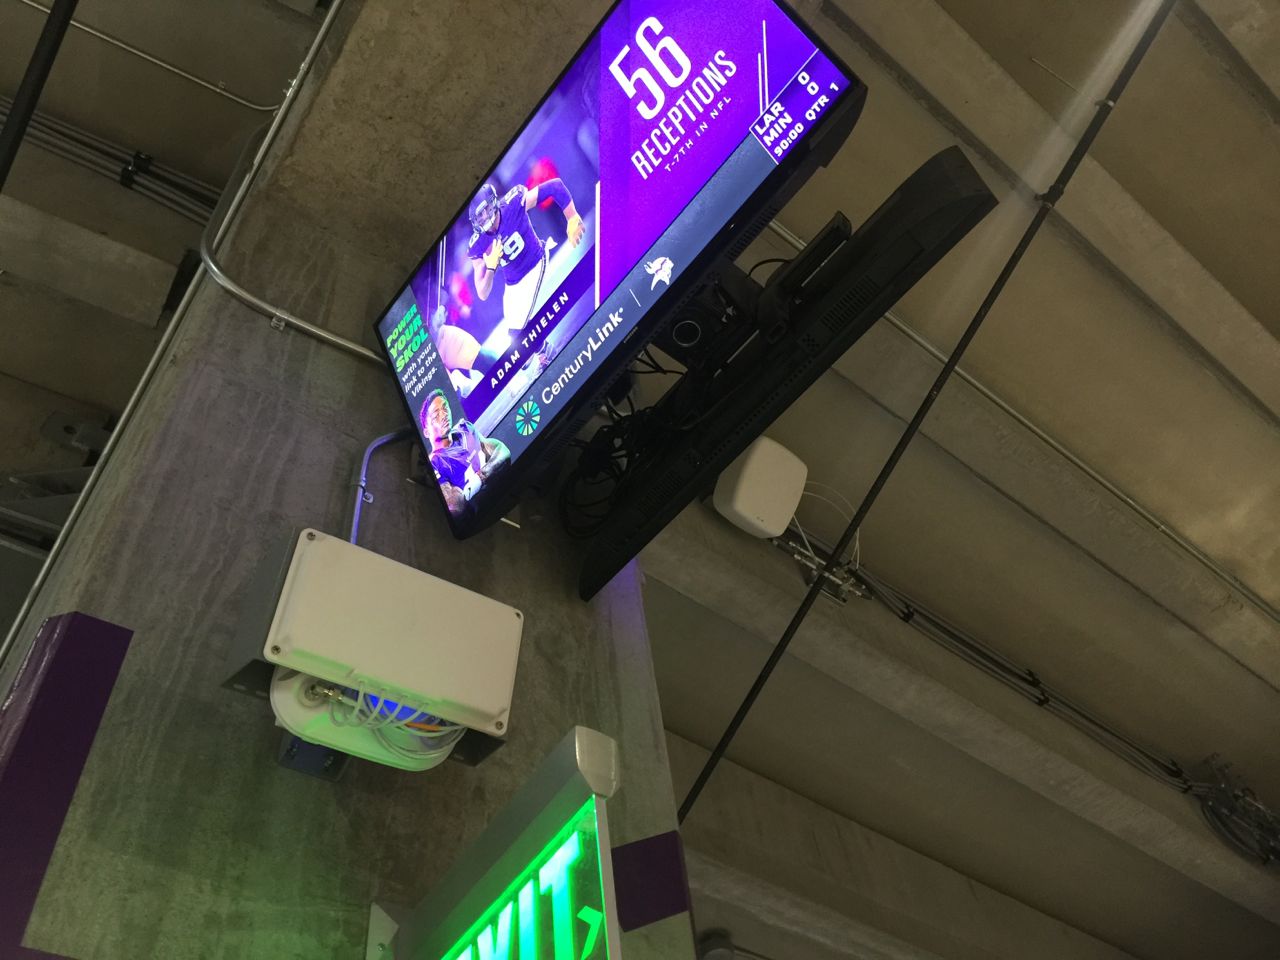
One of the temporary seating under-seat Wi-Fi APs

“The traffic we experience on Wi-Fi networks at the Final Four is considerable each year, and Minneapolis was no exception,” said David Worlock, director of media coordination and statistics for the NCAA tournament. “We were completely satisfied with the performance of the network throughout the weekend.”

THE MSR TOP 20 FOR WI-FI

1. Super Bowl 53, Mercedes-Benz Stadium, Atlanta, Ga., Feb. 3, 2019: Wi-Fi: 24.05 TB
2. NCAA Men’s 2019 Final Four semifinals, U.S. Bank Stadium, Minneapolis, Minn., April 6, 2019: Wi-Fi: 17.8 TB
3. Super Bowl 52, U.S. Bank Stadium, Minneapolis, Minn., Feb. 4, 2018: Wi-Fi: 16.31 TB
4. NCAA Men’s 2019 Final Four championship, U.S. Bank Stadium, Minneapolis, Minn., April 8, 2019: Wi-Fi: 13.4 TB
5. 2018 College Football Playoff Championship, Alabama vs. Georgia, Mercedes-Benz Stadium, Atlanta, Ga., Jan. 8, 2018: Wi-Fi: 12.0 TB*
6. Super Bowl 51, NRG Stadium, Houston, Feb. 5, 2017: Wi-Fi: 11.8 TB
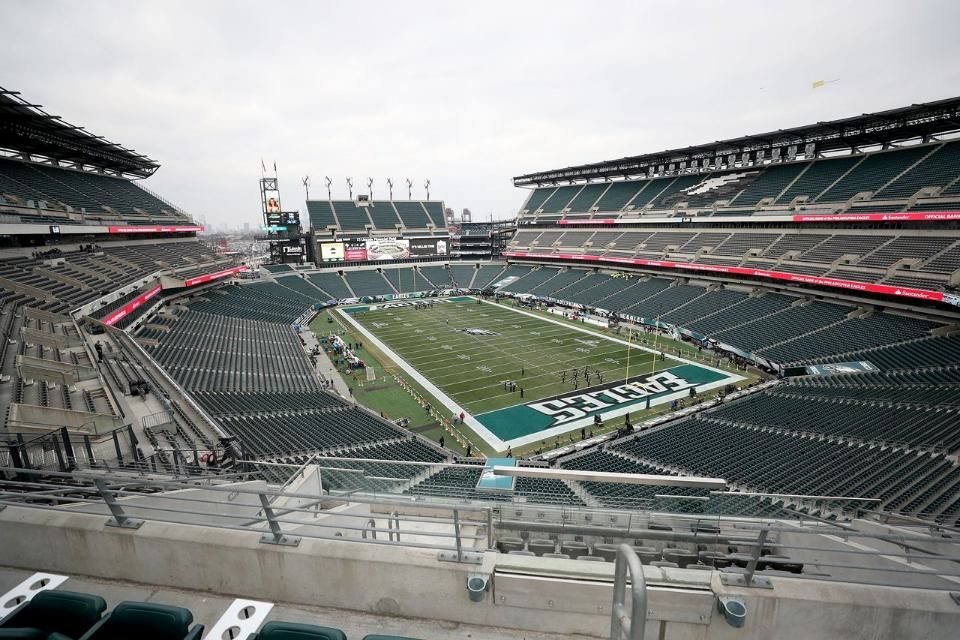
7. Atlanta Falcons vs. Philadelphia Eagles, Lincoln Financial Field, Philadelphia, Pa., Sept. 6, 2018: Wi-Fi: 10.86 TB
8. Super Bowl 50, Levi’s Stadium, Santa Clara, Calif., Feb. 7, 2016: Wi-Fi: 10.1 TB
9. Taylor Swift Reputation Tour, Gillette Stadium, Foxborough, Mass., July 27, 2018: Wi-Fi: 9.76 TB
10. Minnesota Vikings vs. Philadelphia Eagles, NFC Championship Game, Lincoln Financial Field, Philadelphia, Pa., Jan. 21, 2018: Wi-Fi: 8.76 TB
11. Jacksonville Jaguars vs. New England Patriots, AFC Championship Game, Gillette Stadium, Foxborough, Mass., Jan. 21, 2018: Wi-Fi: 8.53 TB
12. Taylor Swift Reputation Tour, Broncos Stadium at Mile High, May 25, 2018: Wi-Fi: 8.1 TB
13. Kansas City Chiefs vs. New England Patriots, Gillette Stadium, Foxborough, Mass., Sept. 7, 2017: Wi-Fi: 8.08 TB
14. SEC Championship Game, Alabama vs. Georgia, Mercedes-Benz Stadium, Atlanta, Ga., Dec. 1, 2018: Wi-Fi: 8.06 TB*
15. Green Bay Packers vs. Dallas Cowboys, Divisional Playoffs, AT&T Stadium, Arlington, Texas, Jan. 15, 2017: Wi-Fi: 7.25 TB
16. Stanford vs. Notre Dame, Notre Dame Stadium, South Bend, Ind., Sept. 29, 2018: 7.19 TB
17. (tie) Southern California vs. Notre Dame, Notre Dame Stadium, South Bend, Ind., Oct. 21, 2017: 7.0 TB
Arkansas State vs. Nebraska, Memorial Stadium, Lincoln, Neb., Sept 2, 2017: Wi-Fi: 7.0 TB
18. WrestleMania 32, AT&T Stadium, Arlington, Texas, April 3, 2016: Wi-Fi: 6.77 TB
19. Wisconsin vs. Nebraska, Memorial Stadium, Lincoln, Neb., Oct. 7, 2017: Wi-Fi: 6.3 TB
20. Super Bowl 49, University of Phoenix Stadium, Glendale, Ariz., Feb. 1, 2015: Wi-Fi: 6.23 TB

* = pending official exact data

Intel True View coming to Niners, Vikings apps; but will anyone watch?

Screen shot of an Intel-powered 3D view of an NFL game.

From a sports viewing standpoint, there may not be a more compelling new technology lately than Intel’s True View platform, which can provide 360-degree 5K-resolution looks at a sporting event that are equally stunning and informative, a true leap in performance for TV-watching fans. Last week, a move by Intel to provide venture funding for app development firm VenueNext seemed like a great deal for fans of the NFL’s San Francisco 49ers and the Minnesota Vikings, whose stadium apps are slated to get the Intel technology to support 3D replay views, perhaps as early as next season.

While both the funding and the replay plans are positive moves for sports fans, our question is, will anyone really watch? While VenueNext’s app platform seems to be gaining momentum with pro teams from all the major U.S. sports leagues, the instant replay function — which was part of VenueNext’s first platform, the app for the Niners’ Levi’s Stadium — has never really caught on, peaking at the start and slowly dwindling thereafter. Replays on other mobile platforms, however — like Twitter — are enormously popular, with one Vikings video alone earning more than 4 million views.

VenueNext CEO John Paul at last week’s Intel event.

Though the Intel/VenueNext announcement garnered a lot of headlines last week, none of the other stories mentioned how little-used the instant replay function is. In fact, almost every team or stadium that has instant-replay functionality in its app declines to provide any statistics for the feature, a shyness we can only attribute to the fact that the numbers are embarrassingly low. The only one VenueNext was able to tell us about was the Niners’ app, which according to VenueNext generated approximately 1,000 views per game last season.

During 2014, the first season Levi’s Stadium was open, the app peaked early with 7,800 replays during that year’s home opener; by the end of the season that number was down to fewer than 4,000 replays per game, which prompted Niners CEO Jed York to label the service’s low uptake a surprising disappointment. Now it’s even used far less often. (VenueNext competitor YinzCam also has instant replay available for many of its team apps, but also does not provide team-by-team viewing stats.)

One reason York cited for the low replay use was the quality and frequency of replays shown on the Levi’s Stadium large video boards; while in the past many pro teams kept replays to a minimum (especially if they were unflattering to the home team) the acceptance of replay review in many leagues and a general change of behavior now sees almost constant replay showing, as well as live action on in-stadium video boards. And while the process to produce in-app video replays is stunningly quick, even the fastest replay functionality combined with the need to navigate a device screen is usually well behind live play.

Screen shot of instant replay service inside Levi’s Stadium app.

Since the amount of funding Intel is providing VenueNext was not announced, it’s hard to tell whether or not either company will consider the transaction worthwhile if the replay viewing numbers remain low. Another problem with the app replays is that many are confined to in-stadium views only due to broadcast rights restrictions; compare that handcuff to the openness of Twitter, where a video of the “Minnesota Miracle” walkoff TD shot by a quick-thinking Minnesota Vikings employee (Scott Kegley, the team’s executive director of digital media & innovation) during last year’s playoffs garnered more than 4 million views and recently won a Webby award.

If there’s a dirty not-so-secret about stadium wireless connectivity, it’s that almost every report we’ve ever seen about app and service usage inside venues puts use of open social media platforms like Twitter, Snapchat and Facebook far, far above team and stadium app usage. Though stadium and team apps are gaining more traction recently due to their embrace of service functionality for things like parking, concession transactions and digital ticketing, we still haven’t seen any reports or evidence that in-stadium instant replays are gaining in use.

Will Intel’s revolutionary technology change the game for in-app replays? We’ll track the developments and keep asking for stats, so stay tuned.

Average per-fan Wi-Fi use total jumps again at Super Bowl 52

Seen in the main concourse at U.S. Bank Stadium: Two IPTV screens, one Wi-Fi AP and a DAS antenna. Credit: Paul Kapustka, MSR

After a year where the actual amount of average Wi-Fi data used per connected fan at the Super Bowl dropped, the trend of more data used per fan reversed itself again to a new peak at Super Bowl 52, with an average total of 407.4 megabytes per user.

Even though the number of unique connections to the Wi-Fi network at U.S. Bank Stadium for Super Bowl 52 also increased to a record 40,033 users (according to the official statistics compiled by Extreme Networks), the jump from 11.8 terabytes of Wi-Fi data used at Super Bowl 51 to 16.31 TB used at Super Bowl 52 pushed the average per-user number to the top, surpassing the 333 MB per user number from Super Bowl 51, as well as the 370 MB per user mark seen at Super Bowl 50.

While this statistic has not ever been called out by the Extreme Networks Super Bowl compilations, we here at MSR think it is a vital mark since it shows that even with more users on the network those connected users are still using more data. That means that IT departments at venues everywhere should probably still plan for no letup in the overall continued growth in demand for bandwidth at large-venue events, especially at “bucket list” events like the Super Bowl.

Last year we guessed the drop in per-user totals from Super Bowl 50 to Super Bowl 51 might have been due to a larger number of autoconnected users, but we never got an answer from the Extreme Networks team when we asked that question. At U.S. Bank Stadium there was also an autoconnect feature to the Wi-Fi for Verizon Wireless customers, but it didn’t seem to affect the per-user total mark.

Minneapolis airport sees 6 TB of Wi-Fi traffic day after Super Bowl

Super Bowl signs hang in the concourse at Minneapolis-St. Paul airport. Credit: MAC (click on any photo for a larger image)

A day after Super Bowl 52 at U.S. Bank Stadium in Minneapolis set new records for wireless data consumption, the Minneapolis-St. Paul International airport had a big wireless day of its own, with 6 terabytes of traffic used on the airport’s Wi-Fi network and another 6.5 TB on the Verizon cellular network.

Eduardo Valencia, vice president and chief information officer for the Metropolitan Airports Commission, said the Wi-Fi data used on Feb. 5 was “close to double typical data consumption” on the free-access network provided by Boingo Wireless, even though the airport saw a fairly normal range of users connecting.

“There was no spike in [the number] of users, but the users who did connect consumed twice as much data, with downloads about 3 times normal,” Valencia said. The Monday-departure crowd, he said, saw about 31,000 unique users connect to the Wi-Fi network, which Valencia said “is at the top of the normal user range” the airport network usually sees. Valencia said that during the week leading up to the big game on Feb. 4, the airport Wi-Fi saw between 23,000 and 31,000 daily connections.

Boingo, which has been powering the Wi-Fi at Minneapolis-St. Paul International Airport (aka MSP) since 2012, updated and expanded coverage a year ago, according to Valencia. Though Boingo would not provide details on how many new APs were added or how many the network has now, Valencia said coverage was increased in many areas, like the tunnels between terminals, to make sure visitors didn’t lose connectivity.

New neutral host DAS from Verizon

Super Bowl LII signage along a moving walkway at MSP. Credit: MAC

The cellular infrastructure at the airport also got an upgrade before the Super Bowl, with a neutral host distributed antenna system (DAS) deployed by Verizon Wireless. The DAS, which uses Corning ONE fiber equipment on the back end, provided coverage for all the top wireless carriers, Valencia said. Though it was cut close — the final pieces went live on Jan. 19, according to Valencia — the expanded DAS, which added antennas all over the terminals as well as outside covering runways, also performed well, according to Valencia.

Though only Verizon stats were available, Valencia said Verizon saw an average of 2.8 TB of data per day in an 11-day span around the Super Bowl, with 6.5 TB of traffic seen on Monday, Feb. 5. Like the Wi-Fi traffic, Valencia said Verizon’s day-after total was about double the average daily consumption.

While there is extra pressure to perform ahead of the NFL’s big game — “The NFL told us the Super Bowl experience begins and ends at the airport,” Valencia said — the payoff will stay for years, as all the new network gear added in advance is permanent.

“We swallowed hard for 9 days, but the success was the culmination of a lot of planning,” Valencia said. “Now the good thing is, everything [in the network] is here to stay.”

Fans use 16.31 TB of Wi-Fi data during Super Bowl 52 at U.S. Bank Stadium

A Wi-Fi handrail enclosure at U.S. Bank Stadium in Minneapolis. Credit: Paul Kapustka, MSR (click on any photo for a larger image)

It is now official — we have a new record for most Wi-Fi data used at a single-day event, as fans at U.S. Bank Stadium in Minneapolis for Super Bowl 52 used 16.31 terabytes of data on the Wi-Fi network.

According to statistics compiled by Extreme Networks during the Philadelphia Eagles’ thrilling 41-33 victory over the New England Patriots Sunday night, the AmpThink-designed network which uses Cisco Wi-Fi gear also saw 40,033 unique users — 59 percent of the 67,612 in attendance — a new top percentage total for any single-game network experience we’ve been told about. (The Dallas Cowboys saw approximately 46,700 unique Wi-Fi users during a playoff game last season, about 50 percent of attendance at AT&T Stadium.)

The network also saw a peak concurrent connection of 25,670 users, and a peak data transfer rate of 7.867 Gbps, according to the numbers released by Extreme. Though Extreme gear was not used in the operation of the network, Extreme has a partnership deal with the NFL under which it provides the “official” network analytics reports from the Super Bowl.

The final total of 16.31 TB easily puts Super Bowl 52 ahead of the last two Super Bowls when it comes to Wi-Fi data use. Last year at NRG Stadium in Houston, there was 11.8 TB of Wi-Fi use recorded, and at Super Bowl 50 in 2016 there was 10.1 TB of Wi-Fi data used at Levi’s Stadium in Santa Clara, Calif. So in reverse chronological order, the last three Super Bowls are the top three Wi-Fi events, indicating that data demand growth at the NFL’s biggest game shows no sign of slowing down. Combined with the 50.2 TB of cellular data used in and around the stadium on game day, Super Bowl 52 saw a total of 66.51 TB of wireless traffic Sunday in Minneapolis.

Confetti fills the air inside U.S. Bank Stadium after the Philadelphia Eagles defeated the New England Patriots in Super Bowl LII. Credit: U.S. Bank Stadium

Super Bowl 52 represented perhaps a leap of faith, in that the handrail-enclosure Wi-Fi design had not yet seen a stress test like that found at the NFL’s biggest event. Now looking ahead to hosting the 2019 Men’s NCAA Basketball Final Four, David Kingsbury, director of IT for U.S. Bank Stadium, can be forgiven for wanting to take a bit of a victory lap before we set our Wi-Fi sights on Atlanta’s Mercedes-Benz Stadium, home of Super Bowl 53.

“AmpThink, CenturyLink and Cisco designed and built a world-class wireless system for U.S. Bank Stadium that handled record-setting traffic for Super Bowl LII,’ Kingsbury said. “AmpThink president Bill Anderson and his team of amazing engineers were a pleasure to work with and the experts at Cisco Sports and Entertainment supported us throughout the multi-year planning process required for an event of this magnitude. High-density wireless networking is such a challenging issue to manage, but I am very happy with our results and wish the team in Atlanta the best next year. The bar has been raised.”

THE LATEST TOP 10 FOR WI-FI

1. Super Bowl 52, U.S. Bank Stadium, Minneapolis, Minn., Feb. 4, 2018: Wi-Fi: 16.31 TB
2. Super Bowl 51, NRG Stadium, Houston, Feb. 5, 2017: Wi-Fi: 11.8 TB
3. Super Bowl 50, Levi’s Stadium, Santa Clara, Calif., Feb. 7, 2016: Wi-Fi: 10.1 TB
4. Minnesota Vikings vs. Philadelphia Eagles, NFC Championship Game, Lincoln Financial Field, Philadelphia, Pa., Jan. 21, 2018: Wi-Fi: 8.76 TB
5. Kansas City Chiefs vs. New England Patriots, Gillette Stadium, Foxborough, Mass., Sept. 7, 2017: Wi-Fi: 8.08 TB
6. Green Bay Packers vs. Dallas Cowboys, Divisional Playoffs, AT&T Stadium, Arlington, Texas, Jan. 15, 2017: Wi-Fi: 7.25 TB
7. Southern California vs. Notre Dame, Notre Dame Stadium, South Bend, Ind., Oct. 21, 2017: 7.0 TB
8. WrestleMania 32, AT&T Stadium, Arlington, Texas, April 3, 2016: Wi-Fi: 6.77 TB
9. Super Bowl 49, University of Phoenix Stadium, Glendale, Ariz., Feb. 1, 2015: Wi-Fi: 6.23 TB
10. Georgia vs. Notre Dame, Notre Dame Stadium, South Bend, Ind., Sept. 9, 2017: Wi-Fi: 6.2 TB

U.S. Bank Stadium in Minneapolis before the start of Super Bowl LII

Eagles see 8.76 TB of Wi-Fi data for NFC Championship game on new Panasonic network

Panasonic Everest Wi-Fi APs (lower left, middle right) mounted underneath an overhang at Lincoln Financial Field in Philadelphia. Credit: Panasonic (click on any photo for a larger image)

The Philadelphia Eagles saw 8.76 terabytes of Wi-Fi data used at Lincoln Financial Field on Jan. 21 during the Eagles’ 38-7 win over the Minnesota Vikings in the NFC Championship game, a new high in one-day Wi-Fi usage for reported marks in games not called the Super Bowl.

Though the game’s position as No. 3 on our unofficial “top Wi-Fi” list (see below) may change as we get reports from other recent NFL playoff games, the mark is nevertheless impressive, and perhaps a big confirmation metric for Panasonic’s nascent big-venue Wi-Fi business. According to Panasonic, its 654-Access Point network inside “The Linc” also saw 35,760 unique connections during the game, out of 69,596 in attendance; the network also saw a peak of 29,201 concurrent devices connected (which happened during the post-game trophy presentation), and saw peak throughput of 5.5 Gbps.

What’s most interesting about the new Panasonic network in Philadelphia is that it is a completely top-down deployment, meaning that most of the APs (especially the 200 used in the seating bowl) shoot signals down toward seats from above. While most new networks at football-sized stadiums (and some smaller arenas) have turned to under-seat or railing-mounted APs to increase network density in seating areas, Panasonic claims its new “Everest” Wi-Fi gear has antennas that can provide signals up to 165 feet away, with “electronically reconfigurable directional beam profiles” that allow for specific tuning of where the Wi-Fi signal can point to.

By also putting four separate Wi-Fi radios into each access point, Panasonic also claims it can save teams and venues money and time on Wi-Fi deployments, since fewer actual devices are needed. By comparison, other big, new network deployments like Notre Dame’s often have a thousand or more APs; Notre Dame, which uses railing-mounted APs in the seating bowl, has 685 in the seating bowl out of a total 1,096 APs. Many of the Notre Dame APs are Cisco 3800 devices, which have two Wi-Fi radios in each AP.

‘The Linc’ before last week’s NFC Championship game. Credit: Kiel Leggere, Eagles

Atlanta’s new Mercedes-Benz Stadium, which uses Aruba Wi-Fi gear mainly deployed under seats in the bowl, has nearly 1,800 APs, with 1,000 of those in the seating bowl.

Antennas close to fans vs. farther away

From a design and performance standpoint, the under-seat or railing-mounted “proximate” networks are built with many APs close together, with the idea that fans’ bodies will intentionally soak up some of the Wi-Fi signal, a fact that network designers use to their advantage to help eliminate interference between radios. The under-seat AP design, believed to be first widely used by AT&T Park in San Francisco and then at a larger scale at Levi’s Stadium in Santa Clara, Calif., was developed to help bring better signals to seats where overhang-mounted APs couldn’t deliver strong connectivity. Older concrete-bowl stadiums like Notre Dame’s also went with a proximate railing design for a similar lack of overhangs.

Though the Eagles’ IT team has repeatedly turned down interview requests from MSR since this summer, Danny Abelson, vice president connectivity for Panasonic Enterprise Solution Company, met with MSR last week to provide details of the deployment. Citing new, patented antenna technology developed specifically by Panasonic to solve the limitations of prior overhead gear, Abelson claims Panasonic can deliver a similar stadium experience for “two-thirds the cost” of an under-seat or railing-mount network design, with savings realized both in construction costs (since it is usually cheaper to install overhead-mounted equipment than under-seat or railing mounts due to drilling needed) and in the need for fewer actual APs, since Panasonic has four radios in its main Wi-Fi APs.

Eagles fans cheering their team to the Super Bowl. Credit: Hunter Martin, Eagles

Abelson, however, declined to provide the exact cost of the Panasonic network at Lincoln Financial Field, citing non-disclosure agreements. There are also more questions to be answered about a Panasonic deployment’s cost, including charges for management software and/or administration services. Currently, Abelson said, Panasonic includes the costs for management software and management personnel in its bids.

When it comes to how the Eagles found Panasonic, the team and the company already had an existing relationship, as Panasonic’s video-board division had previously supplied displays for the Linc. According to Abelson, Panasonic went through a performance test at several Eagles games last season, bringing in Wi-Fi gear to see if the new technology could provide coverage to areas where the Eagles said they had seen lower-quality coverage before. One of the forerunners in the NFL in bringing Wi-Fi to fans, the Eagles had previously used Extreme Networks Wi-Fi gear to build a fan-facing network in 2013. Though the Eagles would not comment about the selection process, after issuing an RFP this past offseason the team chose Panasonic for a new network, which Abelson said was deployed in three months during the football offseason.

Re-opening the debate for antenna placement?

Though Mobile Sports Report has not yet been able to get to Philadelphia to test the new network in a live game-day situation, if Panasonic’s new gear works as promises the company may find many potential interested customers, especially those who had shied away from deploying under-seat networks due to the construction issues or costs.

The Panasonic system may be of particular interest to indoor arenas, like hockey and basketball stadiums, where the gear could be potentially mounted in catwalk areas to cover seating. John Spade, CTO for the NHL’s Florida Panthers and BB&T Center in Sunrise, Fla., has tweeted favorably about a Panasonic deployment going in at the arena whose networks he oversees:

But even as the impressive 8.76 TB mark seen at the NFC Championship game now sits as the third-highest reported Wi-Fi data use event we’ve heard of (behind only the 10.1 TB of Wi-Fi seen at Super Bowl 50 and the 11.8 TB seen at Super Bowl 51), that number may fall a bit down the list if we ever get verified numbers for some network totals we’ve heard rumors about lately. (Or even any older ones! C’mon network teams: Check out the list below and let us know if we’ve missed any.)

So far this season, we haven’t gotten any reports of Wi-Fi usage out of the network team at Atlanta’s Mercedes-Benz Stadium (which recently hosted the college football playoff championship game), and we’ve only heard general talk about oversized playoff-game traffic at U.S. Bank Stadium in Minneapolis, home of Sunday’s Super Bowl 52. Like Notre Dame Stadium, U.S. Bank Stadium uses a mostly railing-mounted AP deployment in its seating bowl; both networks were designed by AmpThink. We are also still waiting for reports from last week’s AFC Championship game at Gillette Stadium, where the previous non-Super Bowl top mark of 8.08 TB was set in September; and from any games this fall at AT&T Stadium in Arlington, Texas, where the NFL’s biggest stadium has 2,567 Wi-Fi APs.

Will overhead still be able to keep up as demand for more bandwidth keeps growing? Will Panasonic’s claims of lower costs for equal performance hold up? At the very least, the performance in Philadelphia could re-open debate about whether or not you need to deploy APs closer to fans to provide a good Wi-Fi experience. If all goes well, the winners in renewed competition will be venues, teams, and ultimately, fans.

THE LATEST TOP 10 FOR WI-FI

1. Super Bowl 51, NRG Stadium, Houston, Feb. 5, 2017: Wi-Fi: 11.8 TB
2. Super Bowl 50, Levi’s Stadium, Santa Clara, Calif., Feb. 7, 2016: Wi-Fi: 10.1 TB
3. Minnesota Vikings vs. Philadelphia Eagles, NFC Championship Game, Lincoln Financial Field, Philadelphia, Pa., Jan. 21, 2018: Wi-Fi: 8.76 TB
4. Kansas City Chiefs vs. New England Patriots, Gillette Stadium, Foxborough, Mass., Sept. 7, 2017: Wi-Fi: 8.08 TB
5. Green Bay Packers vs. Dallas Cowboys, Divisional Playoffs, AT&T Stadium, Arlington, Texas, Jan. 15, 2017: Wi-Fi: 7.25 TB
6. Southern California vs. Notre Dame, Notre Dame Stadium, South Bend, Ind., Oct. 21, 2017: 7.0 TB
7. WrestleMania 32, AT&T Stadium, Arlington, Texas, April 3, 2016: Wi-Fi: 6.77 TB
8. Super Bowl 49, University of Phoenix Stadium, Glendale, Ariz., Feb. 1, 2015: Wi-Fi: 6.23 TB
9. Georgia vs. Notre Dame, Notre Dame Stadium, South Bend, Ind., Sept. 9, 2017: Wi-Fi: 6.2 TB
10. Alabama vs. Texas A&M, Kyle Field, College Station, Texas, Oct. 17, 2015: Wi-Fi: 5.7 TB

https://duwit.ukdw.ac.id/document/pengadaan/slot777/

https://mtsnupakis.sch.id/wp-content/zeusslot/

https://insankamilsidoarjo.sch.id/wp-content/slot-zeus/

https://smpbhayangkari1sby.sch.id/wp-content/slot-zeus/

https://alhikamsurabaya.sch.id/wp-content/slot-thailand/

https://mtsnupakis.sch.id/wp-content/bonus-new-member/

https://smptagsby.sch.id/wp-content/slot-bet-200/

https://lookahindonesia.com/wp-content/bonus-new-member/

https://ponpesalkhairattanjungselor.sch.id/wp-content/mahjong-slot/

https://mtsnupakis.sch.id/wp-content/slot777/

https://sdlabum.sch.id/wp-content/slot777/

https://sdlabumblitar.sch.id/wp-content/bonus-new-member/

https://sdlabumblitar.sch.id/wp-content/spaceman/

https://paudlabumblitar.sch.id/wp-content/spaceman/