Temporary courtside network helps set Final Four Wi-Fi records

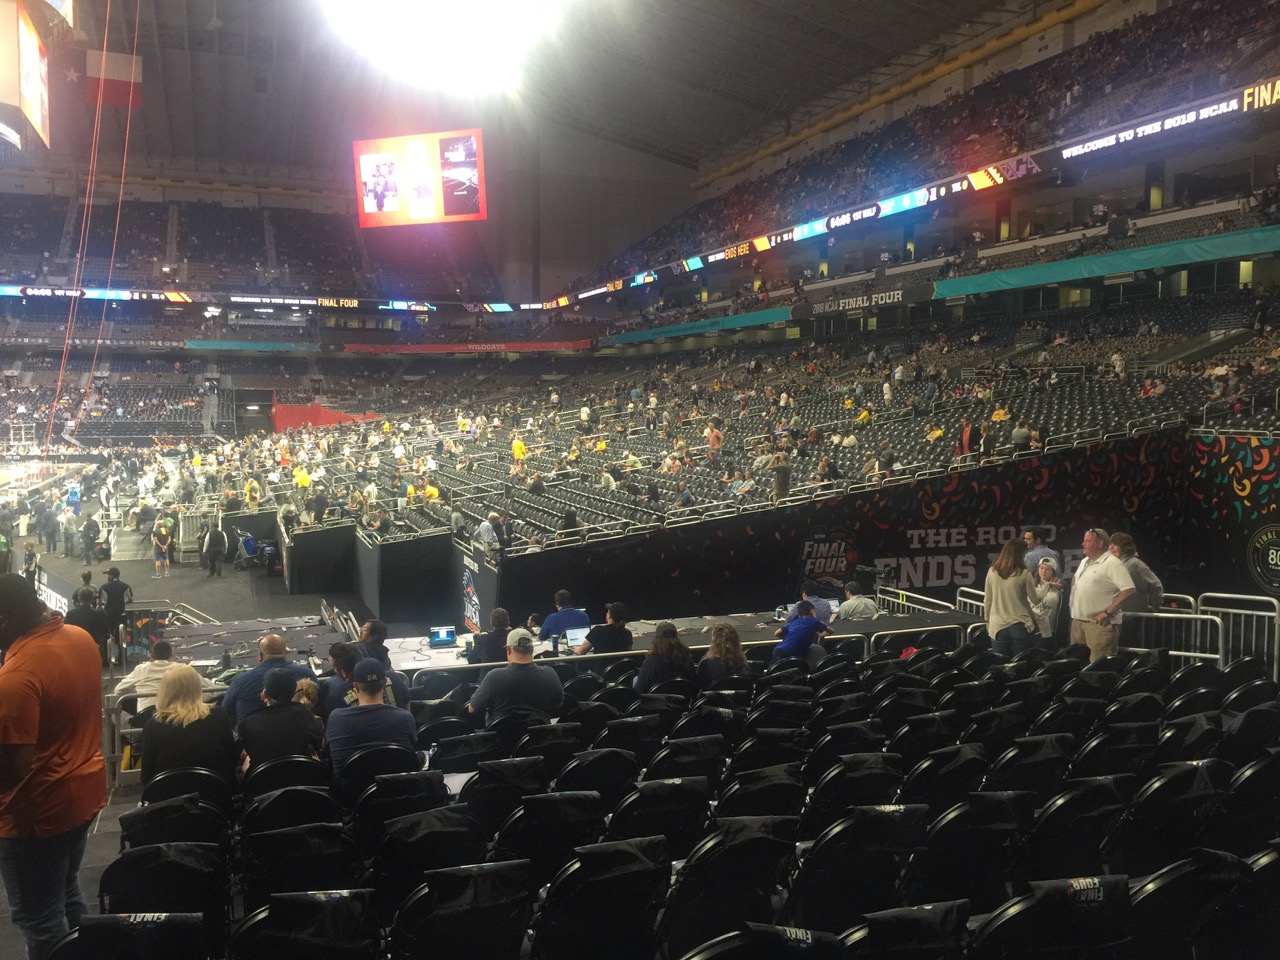
A temporary under-seat Wi-Fi network helped bring connectivity to courtside seats at this year’s Final Four. Credit all photos: Paul Kapustka, MSR (click on any picture for a larger image)

One of the traditional characteristics of the Final Four is the yearly travel scramble of the fortunate fans and teams who have advanced to the championship weekend. Somehow, with only a week’s notice, plane flights, road trips and hotel rooms get scheduled and booked, leading to packed houses at college basketball’s biggest event.

On the stadium technology side, a similar last-minute fire drill happens just about every year as well, as the hosting venues reconfigure themselves to host basketball games inside cavernous buildings built mainly to hold football crowds. At this year’s NCAA Men’s Final Four at U.S. Bank Stadium in Minneapolis, the stadium tech team and partner AmpThink were able to quickly construct a temporary Wi-Fi network to cover the additional lower-bowl seating. The new capactity was part of a record-setting Wi-Fi network performance at the venue, with single-day numbers surpassing those from Super Bowl 52, held in the same building the year before.

The Wi-Fi numbers, both staggering and sobering especially to venues who are next in line for such bucket-list events, totaled 31.2 terabytes for the two days of game action, according to figures provided by the NCAA. For the semifinal games on Saturday April 6, U.S. Bank Stadium’s Wi-Fi network saw 17.8 TB of traffic, topping the 16.31 TB used during Super Bowl 52 on Feb. 4, 2018. The Saturday semifinals also set an attendance record for the venue, with 72,711 on hand, topping the 67,612 in attendance for Super Bowl 52.

During the championship game on April 8, U.S. Bank Stadium saw an additional 13.4 TB of data used on the Wi-Fi network, giving the venue three of the top four single-day Wi-Fi numbers we’ve reported, with this year’s mark of 24.05 TB at Super Bowl 53 in Atlanta the only bigger number. Saturday’s take rate at U.S. Bank Stadium, however, surpassed even the most-recent Super Bowl, with 51,227 unique users on the network, a 70 percent take rate.

‘Like building an arena network inside a football stadium’

Editor’s note: This report is from our latest STADIUM TECH REPORT, an in-depth look at successful deployments of stadium technology. Included with this report is a profile of the new Wi-Fi network at Allianz Field in St. Paul, Minn., and an in-depth research report on the new Wi-Fi 6 standard! DOWNLOAD YOUR FREE COPY now!

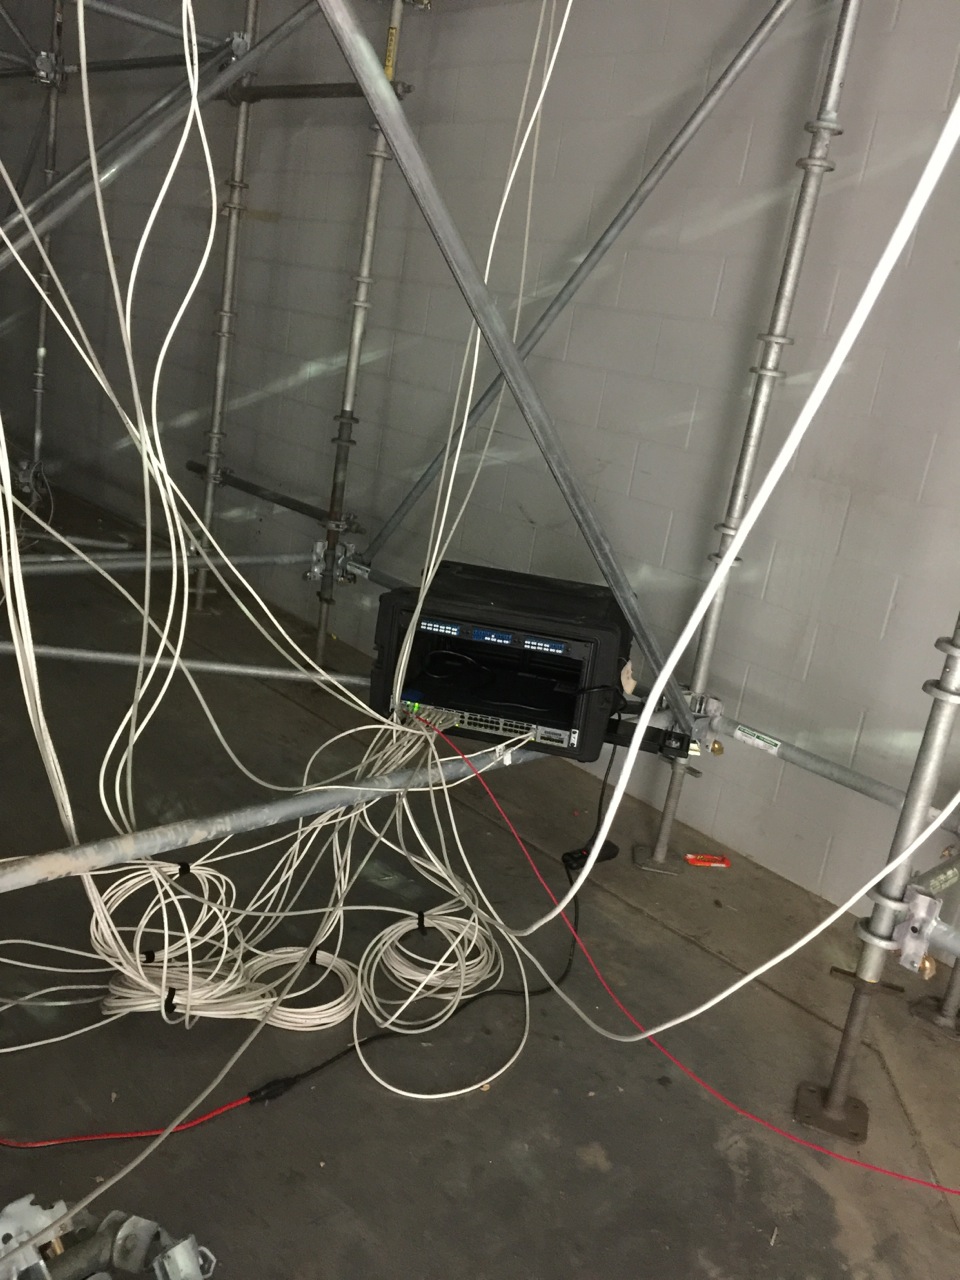
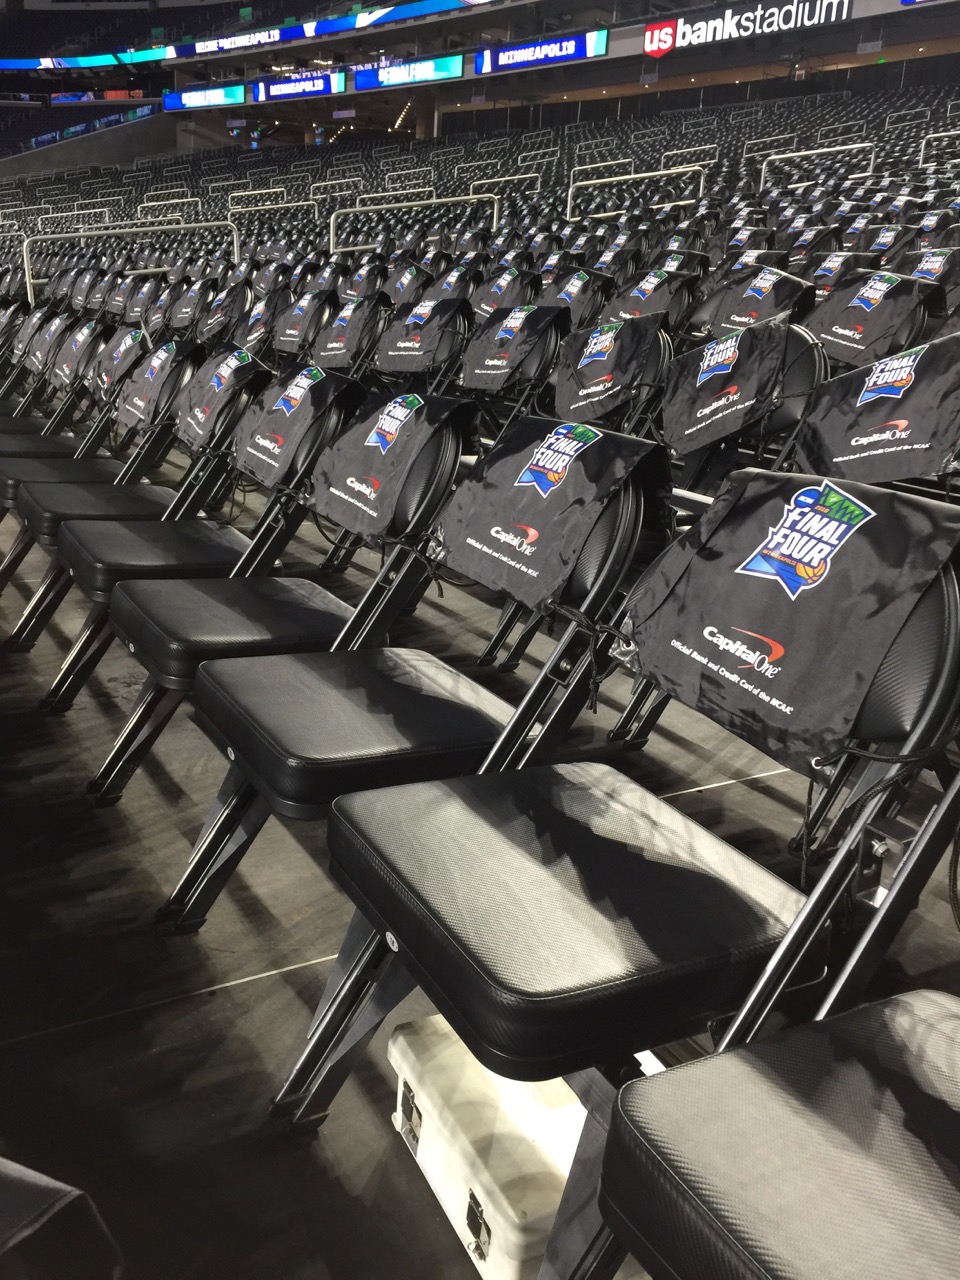
Switches for the temporary network were deployed under the seat scaffolding.

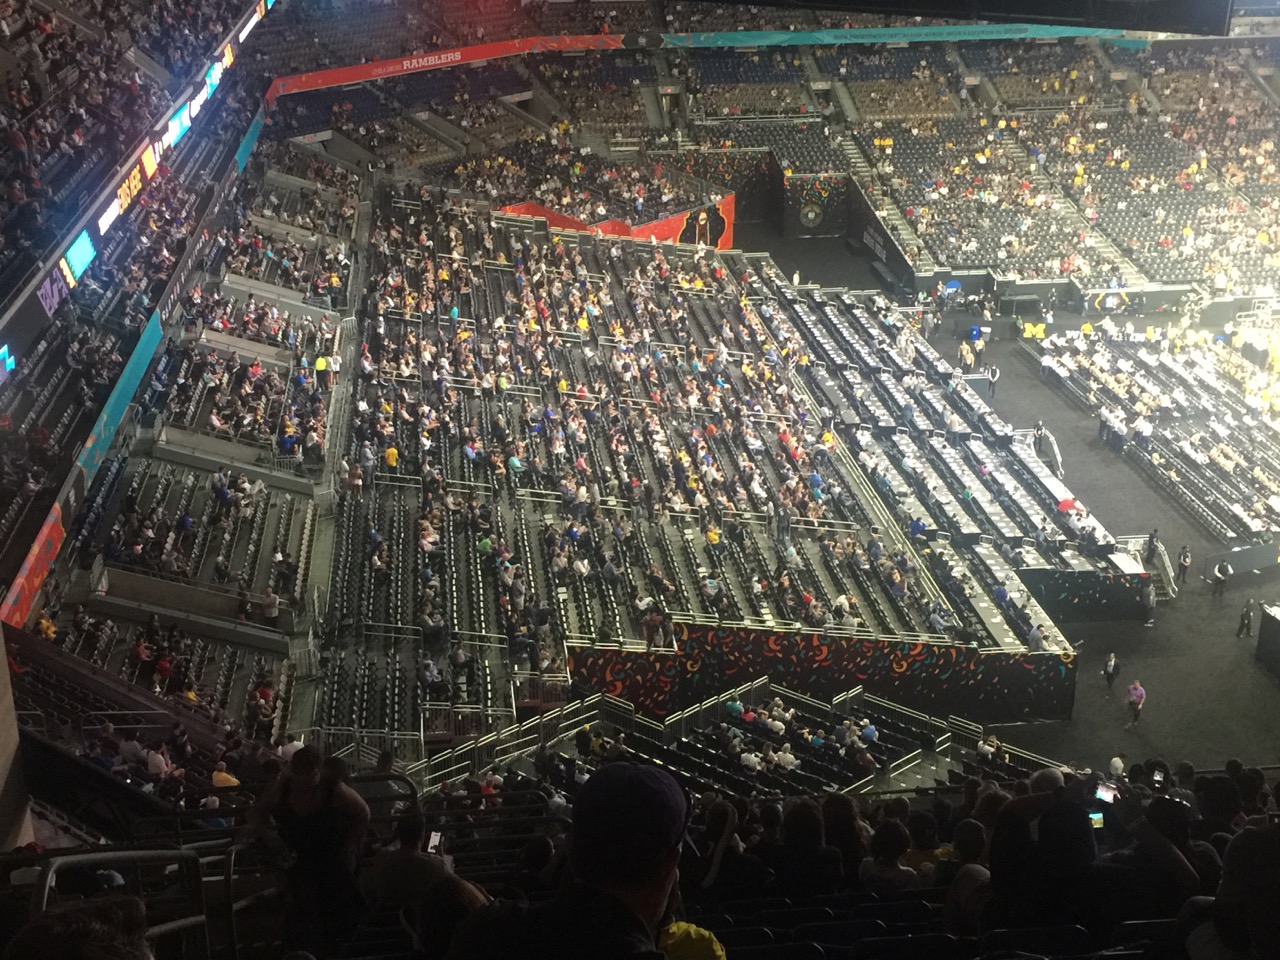
There’s no doubt that the temporary network installed by AmpThink and the U.S. Bank Stadium IT team contributed a great deal to the final Wi-Fi totals, with 250 access points installed in the additional seats. Like at other football venues that are transformed into basketball arenas, U.S. Bank Stadium had temporary seating installed on all four sides of the stadium, with temporary risers stretching down over football seating as well as with risers built behind both baskets. More seats were installed on the “floor” of the football field, right up to the elevated court set in the middle. The temporary APs, like the existing ones in the stadium, are from Cisco.

“There are a lot more moving parts to a Final Four than to a Super Bowl,” said David Kingsbury, director of IT for U.S. Bank Stadium, describing the difference in providing the networking and technical underpinnings for each event. While planning for the networks was obviously done far in advance, the actual buildout of the temporary Wi-Fi couldn’t even begin until the additional seating was in place, a task that finished just five days before the first game was played.

That’s when AmpThink deployed a staff of 12 workers to start connecting cables to APs and to switches, while also adding in another 700 wired network connections to the courtside areas for media internet and TV monitor connections. Like it does for every venue network it designs and deploys, AmpThink came to the stadium equipped with a wide assortment of lengths of pre-terminated cables, preparation that made the fast deployment possible.

“If we had to spin raw cable and terminate it on site, we never would have been able to finish in five days,” said AmpThink president Bill Anderson.

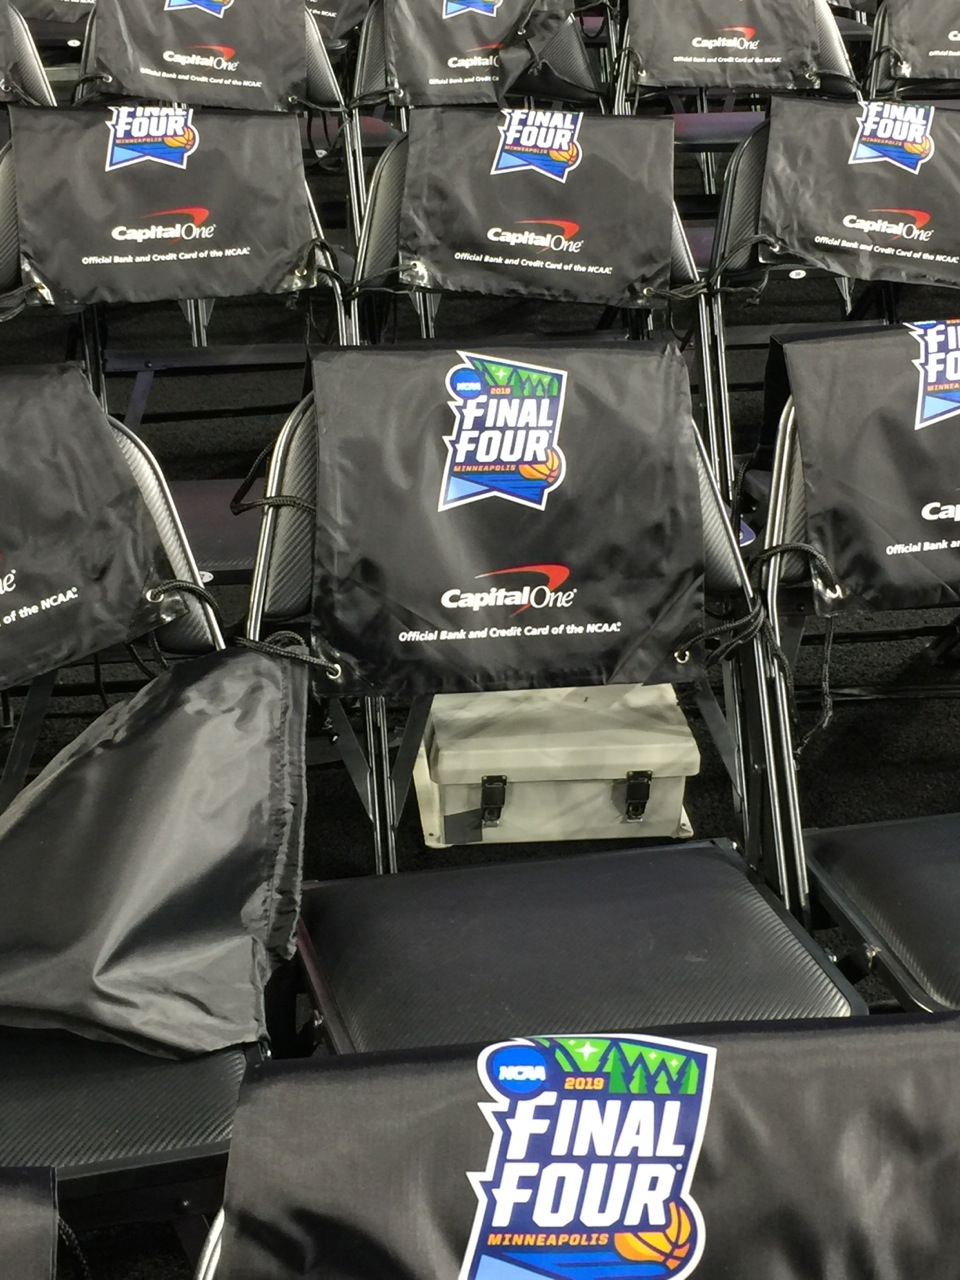
AmpThink’s previous experience in deploying such temporary networks under temporary seating — including at the previous year’s Final Four in San Antonio — taught the company that it would also need protection for under-seat switch deployments, to fend off the inevitable liquid spills from the seats above. That requirement was potentially even more necessary at U.S. Bank Stadium, since this year’s Final Four was the first to allow in-venue sales of alcoholic beverages.

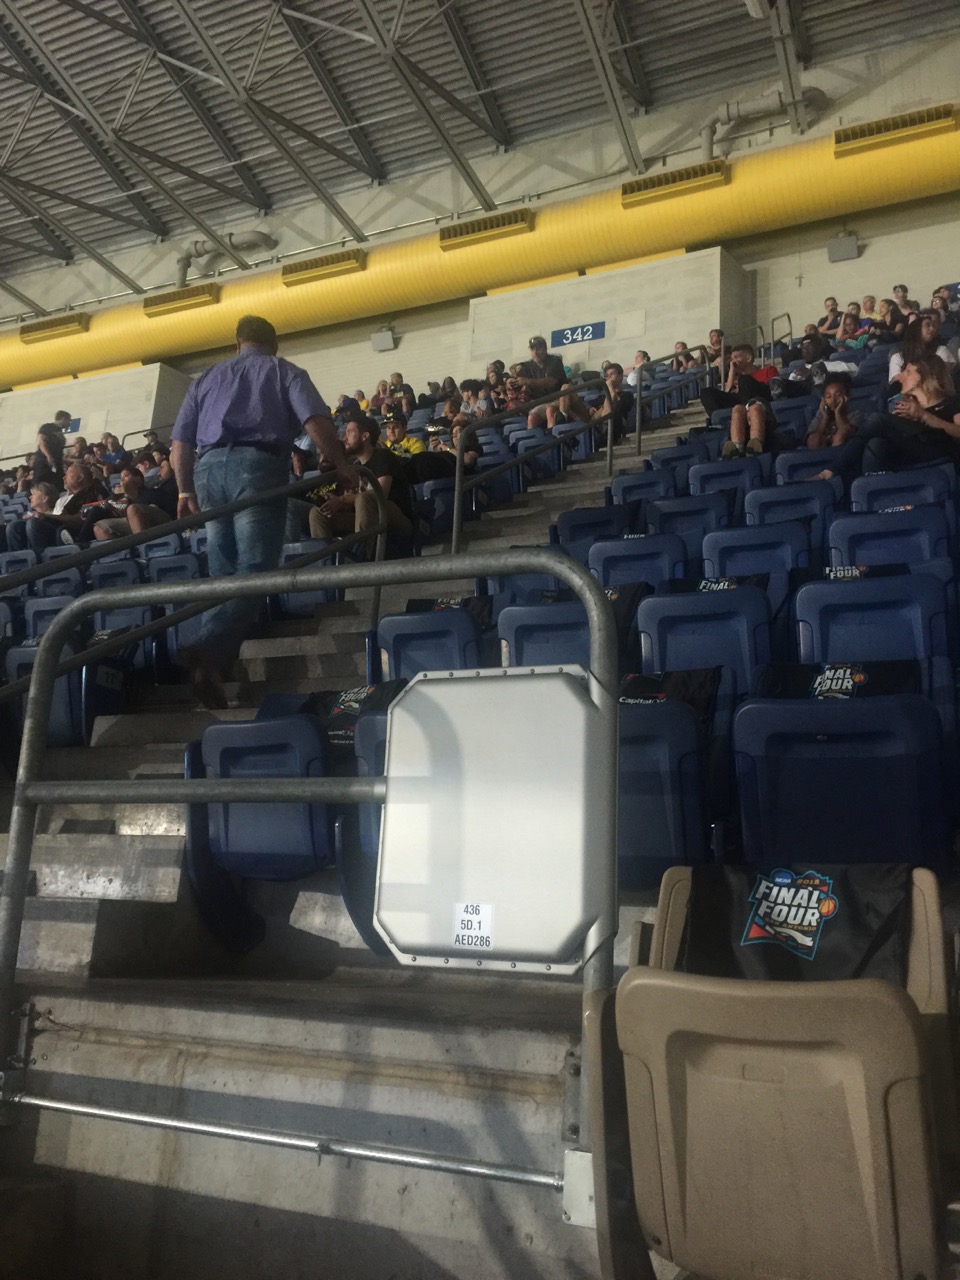
Some temporary seats were deployed on top of existing lower bowl seats.

With some of the temporary seating installed over existing seating, there were 95 APs in the existing handrail-enclosure design that had to be turned off for the Final Four, according to Kingsbury. The 250 new APs added were all installed under the folding chairs, in enclosures that simply sat on the floor.

According to AmpThink’s Anderson, the company did learn a lesson at U.S. Bank Stadium — that it will, at future events, need to secure the actual enclosures since during the weekend curious fans opened a few of the boxes, with one AP disappearing, perhaps as an interesting IT souvenir.

In San Antonio, AmpThink had zip-tied the enclosures to chairs, which led to increased labor to detatch the devices during the post-event breakdown. While having no such measures at U.S. Bank led to a fast removal — AmpThink said it had removed all the temporary network elements just seven hours after the championship game confetti had settled — for next year’s Final Four AmpThink plans to at least zip-tie the enclosures shut so that fans can’t attempt any ad hoc network administration.

More APs for back of house operations

Another difference between the Final Four and the Super Bowl is the fact that four, not two, teams are in attendance for a full weekend, necessitating the need to set up temporary “work rooms” adjacent to each school’s locker room area. The media work center for the Final Four is also typically larger than that of a Super Bowl, again with more cities and their attendant media outlets on site thanks to there being four, not just two, teams involved.

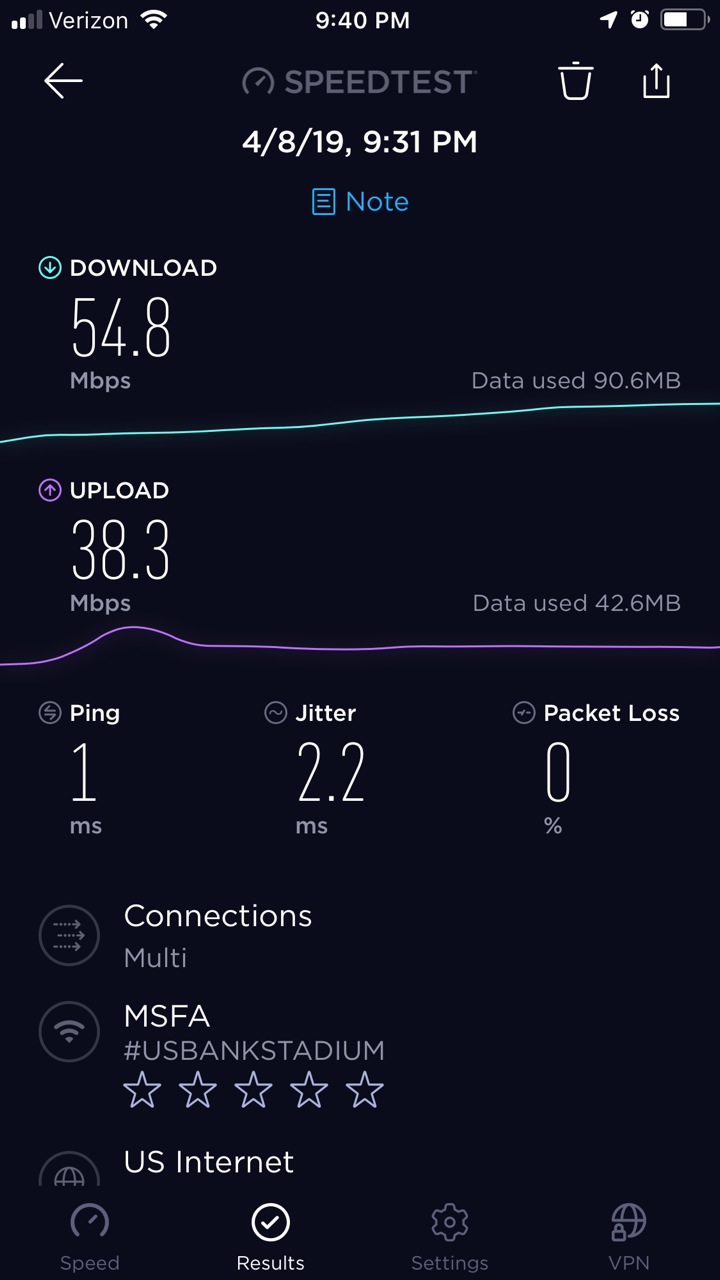
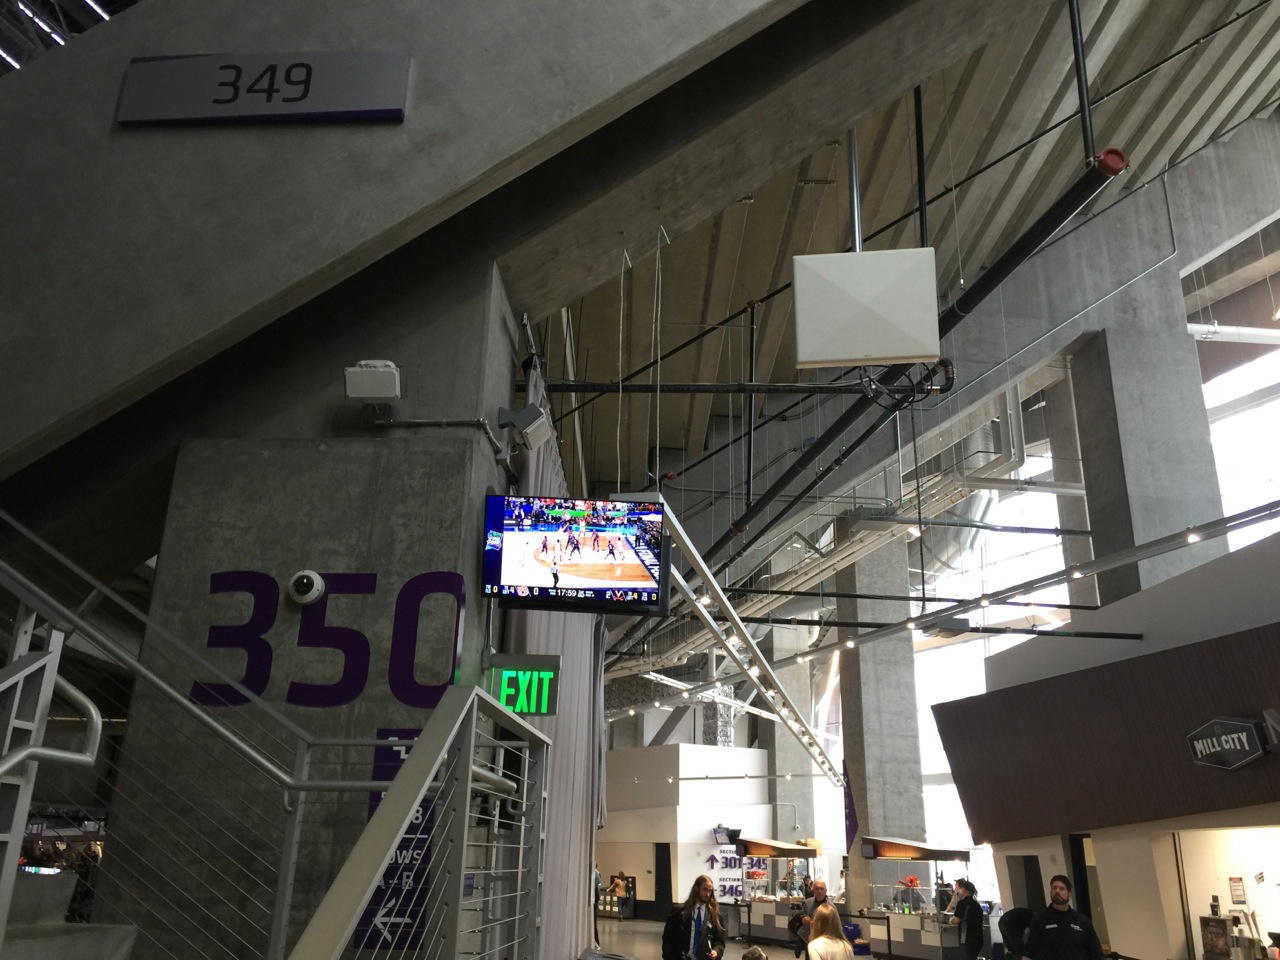
A concourse speed test taken just after halftime of the final game.

“We had to cover a lot of places in the stadium that we don’t normally cover” with wireless and wired network access, Kingsbury said, saying that an additional 30 APs were needed for team rooms and the main media workspace, which were located on the field level of the stadium in the back hallways. An interesting note at U.S. Bank Stadium was that the yards and yards of fabric used as curtains to cover the clear-plastic roofing and wall areas was actually benefical to Wi-Fi operations, since it cut off some of the reflective interference caused by ETFE surfaces.

According to Kingsbury the final count of active APs for the Final Four was 1,414, a number reached by adding in the temporary APs while deducting the ones taken offline. Not included in the official NCAA traffic numbers was an additional 3 TB of traffic seen during the free-admission Friday practice sessions, when 36,000 fans visited the stadium, with 9,000 joining the Wi-Fi network.

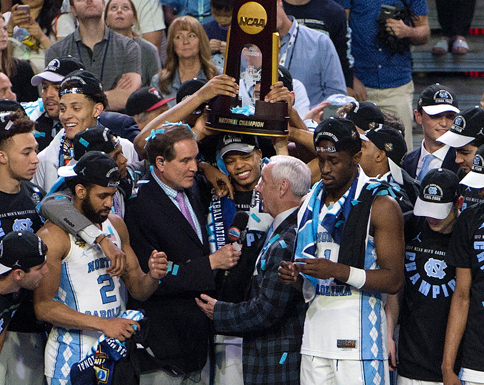
From the official stats, the peak concurrent user number from Final Four Saturday of 31,141 was also an overall record, beating Super Bowl 53’s mark of 30,605. (Super Bowl 53 had 70,081 fans in attendance for the Feb. 3 game between the New England Patriots and the Los Angeles Rams.) The Wi-Fi network numbers for Monday’s championship game (won by Virginia 85-77 over Texas Tech in overtime) saw big numbers itself, with 13.4 TB of total data used, and 48,449 unique connections and 29,487 peak concurrent users (out of 72,062 in attendance). Monday’s game also produced a peak throughput number of 11.2 Gbps just after the game ended.

None of those totals could have been reached without the temporary network, which AmpThink’s Anderson compared to “building a 10,000-seat arena network inside a football stadium.” Next stop for a temporary Wi-Fi network is Mercedes-Benz Stadium in Atlanta, where the 2020 Final Four awaits.

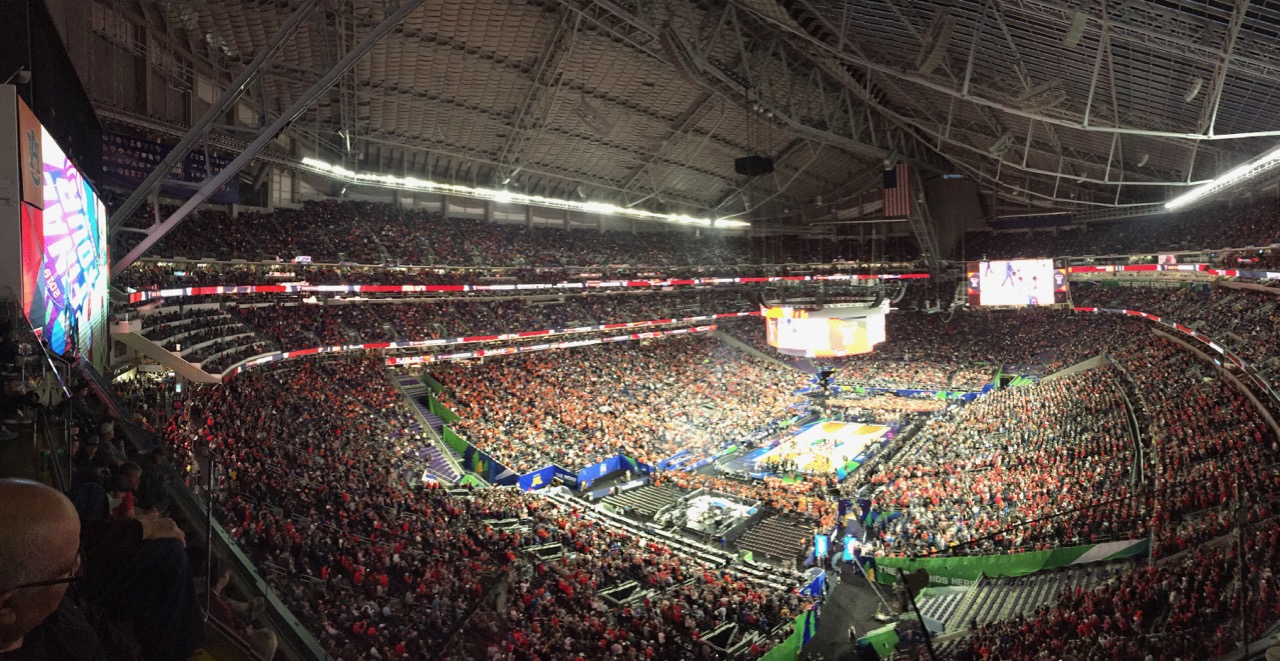
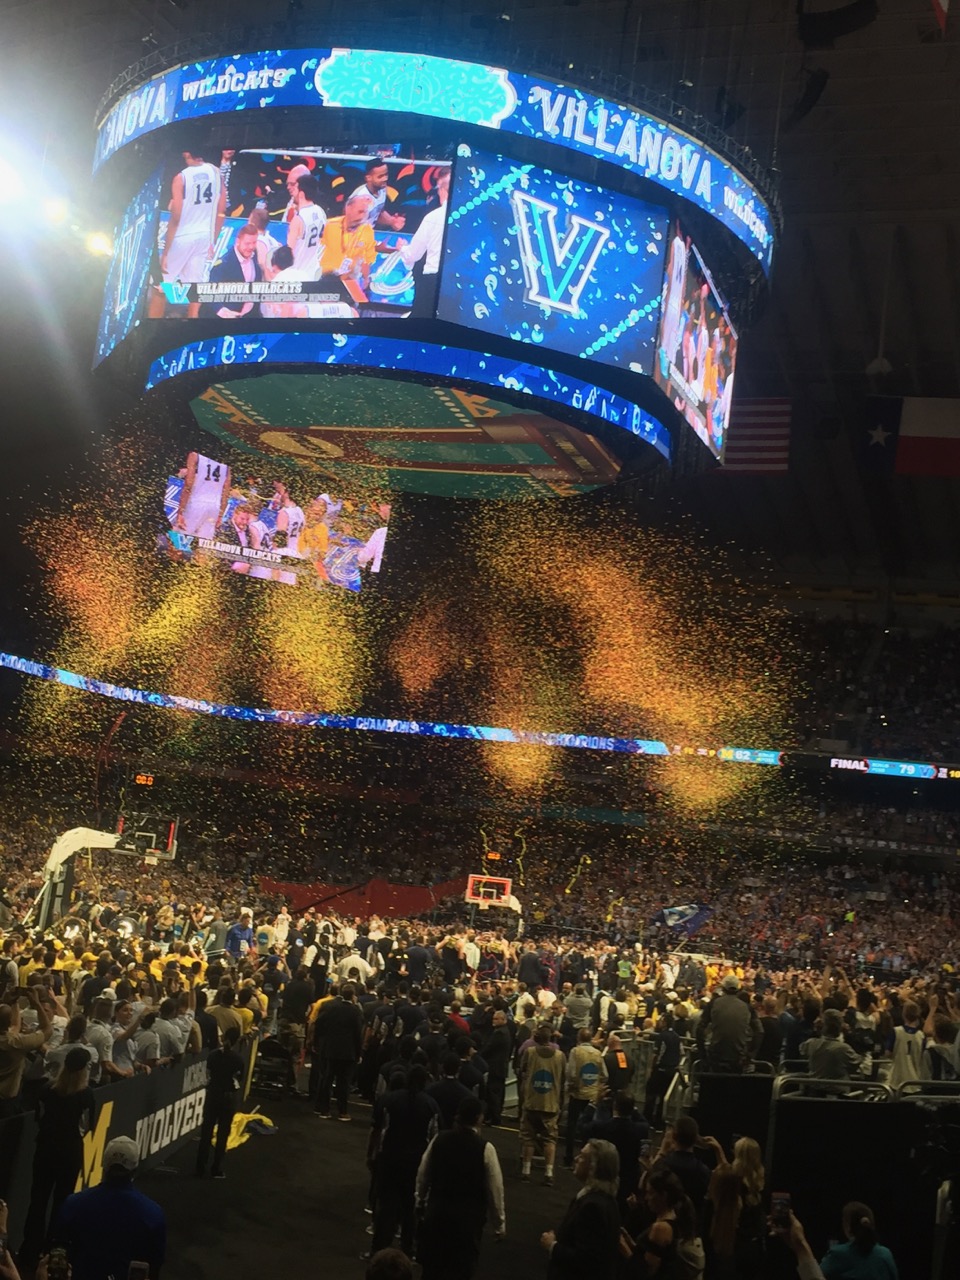
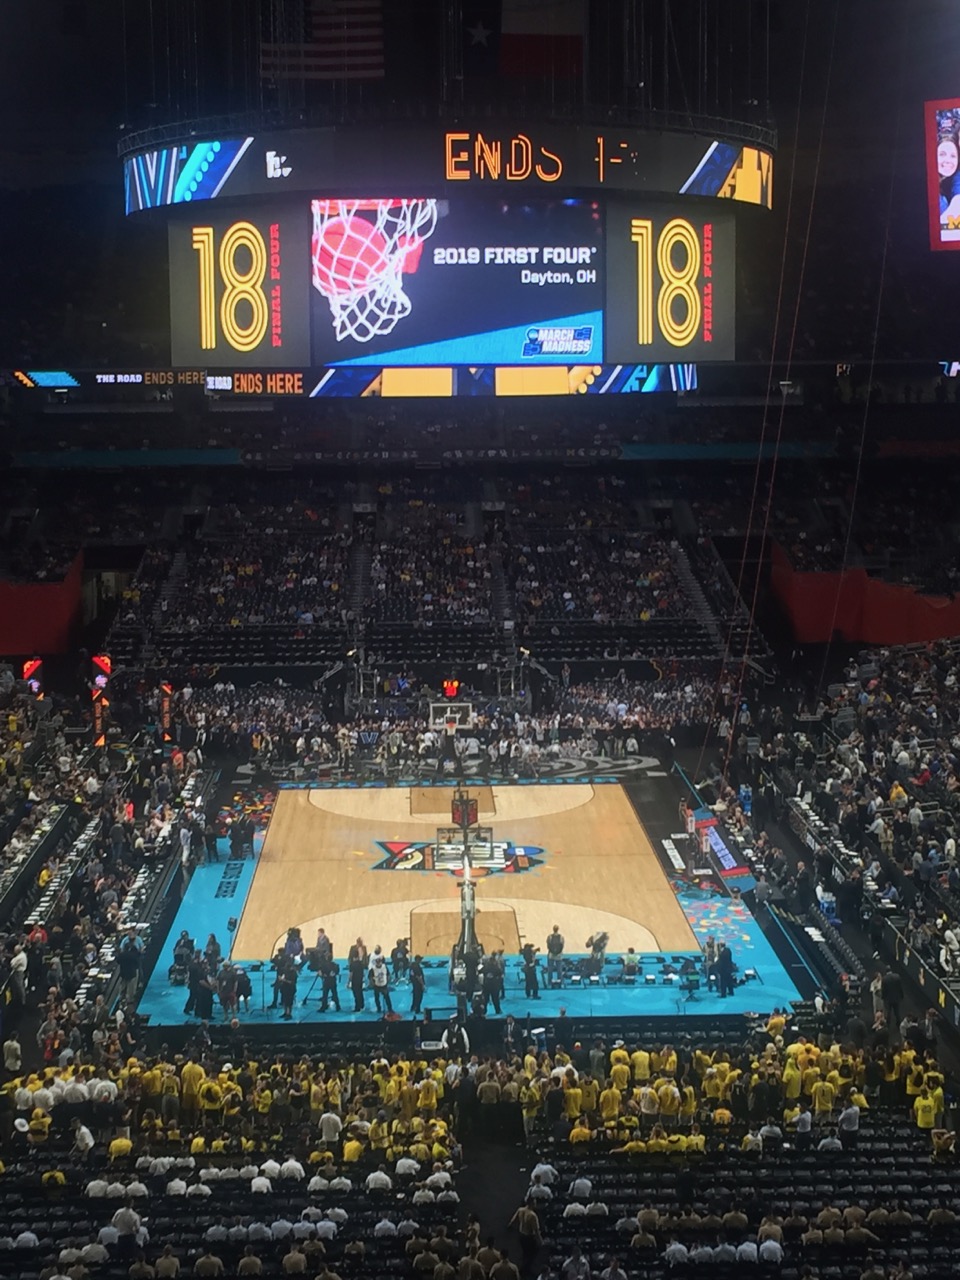
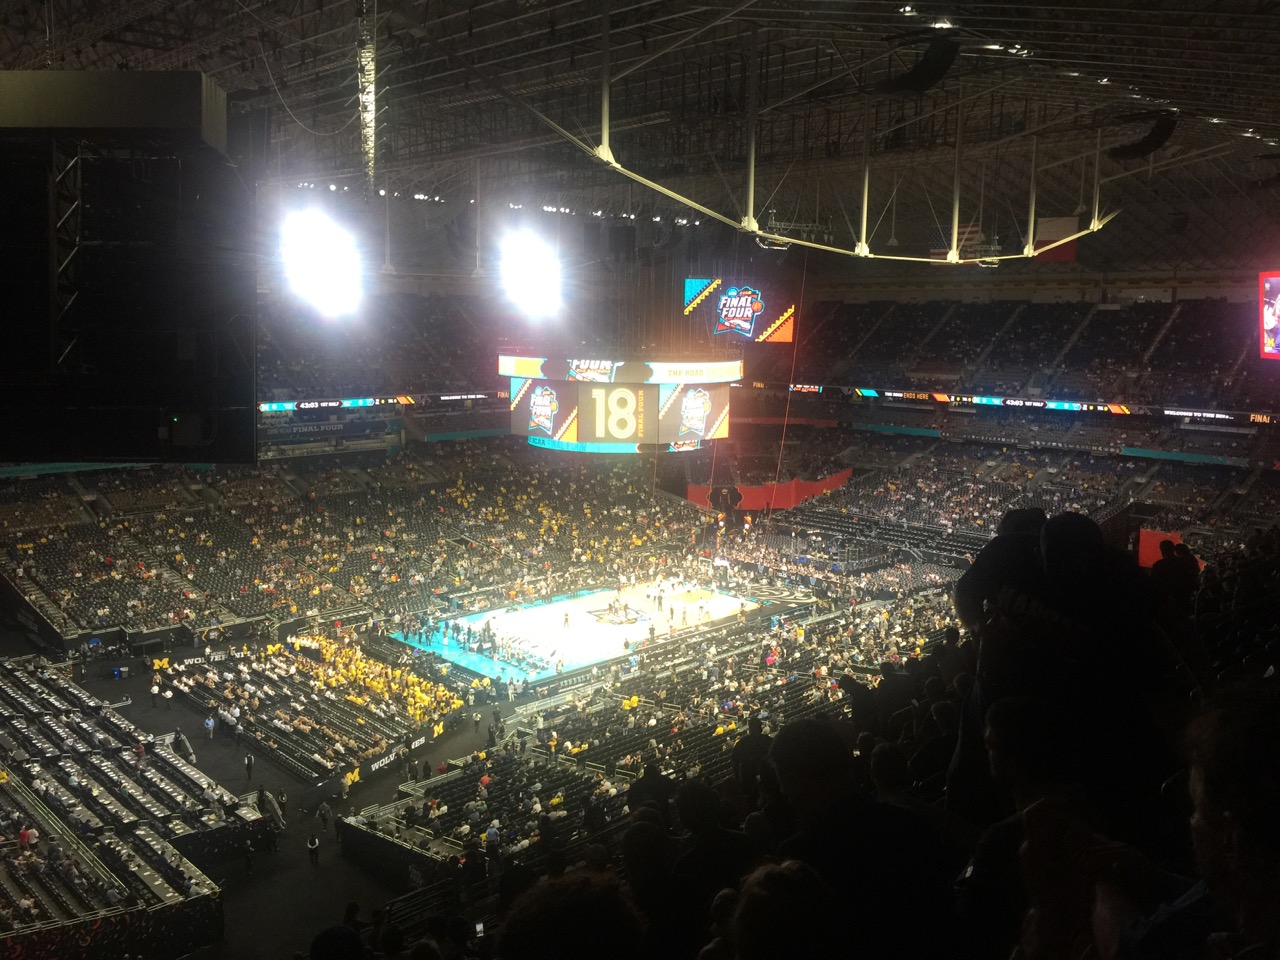
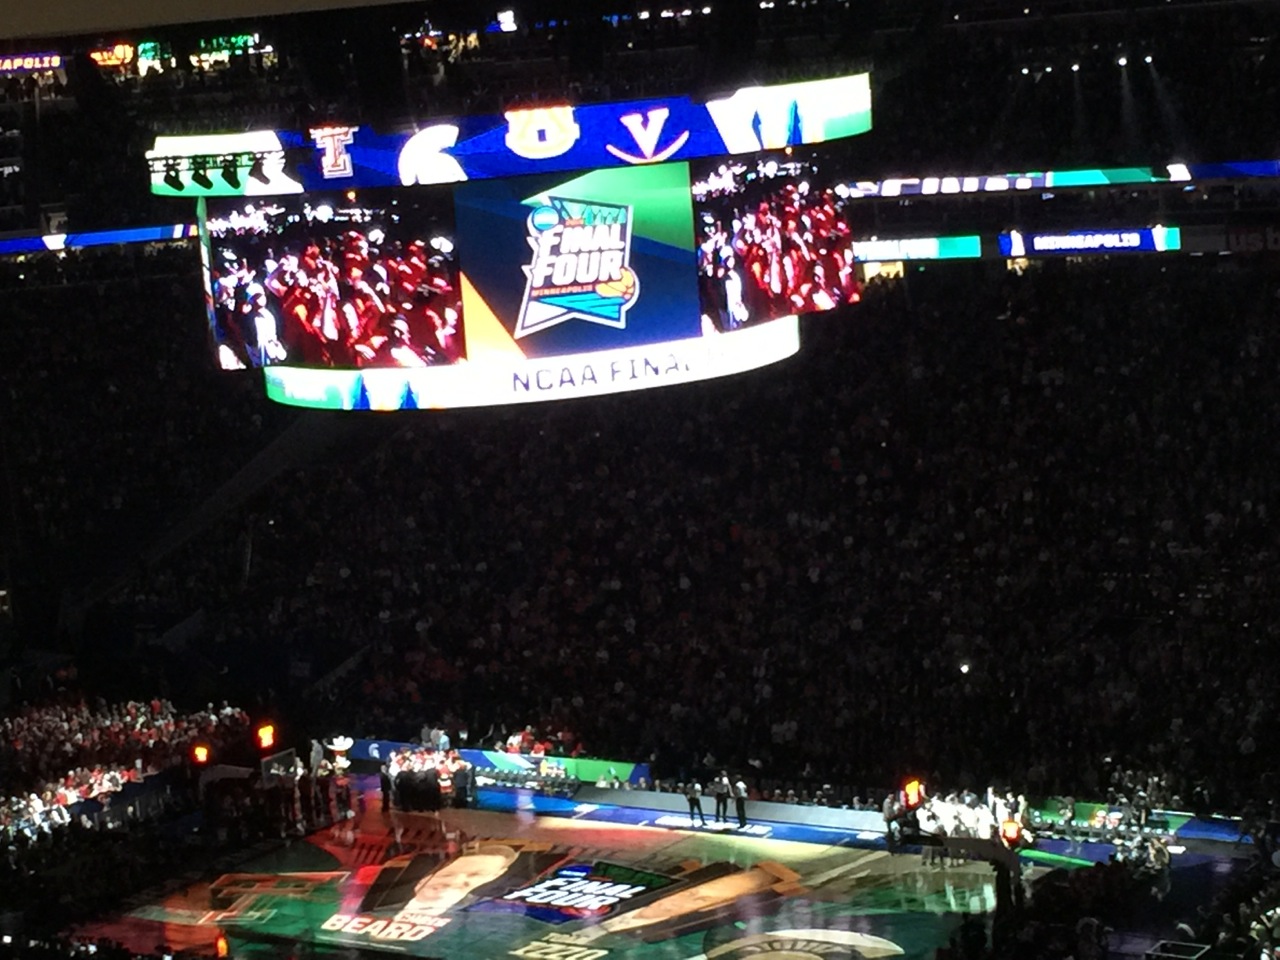
This is what your football stadium looks like with a championship basketball game inside of it.

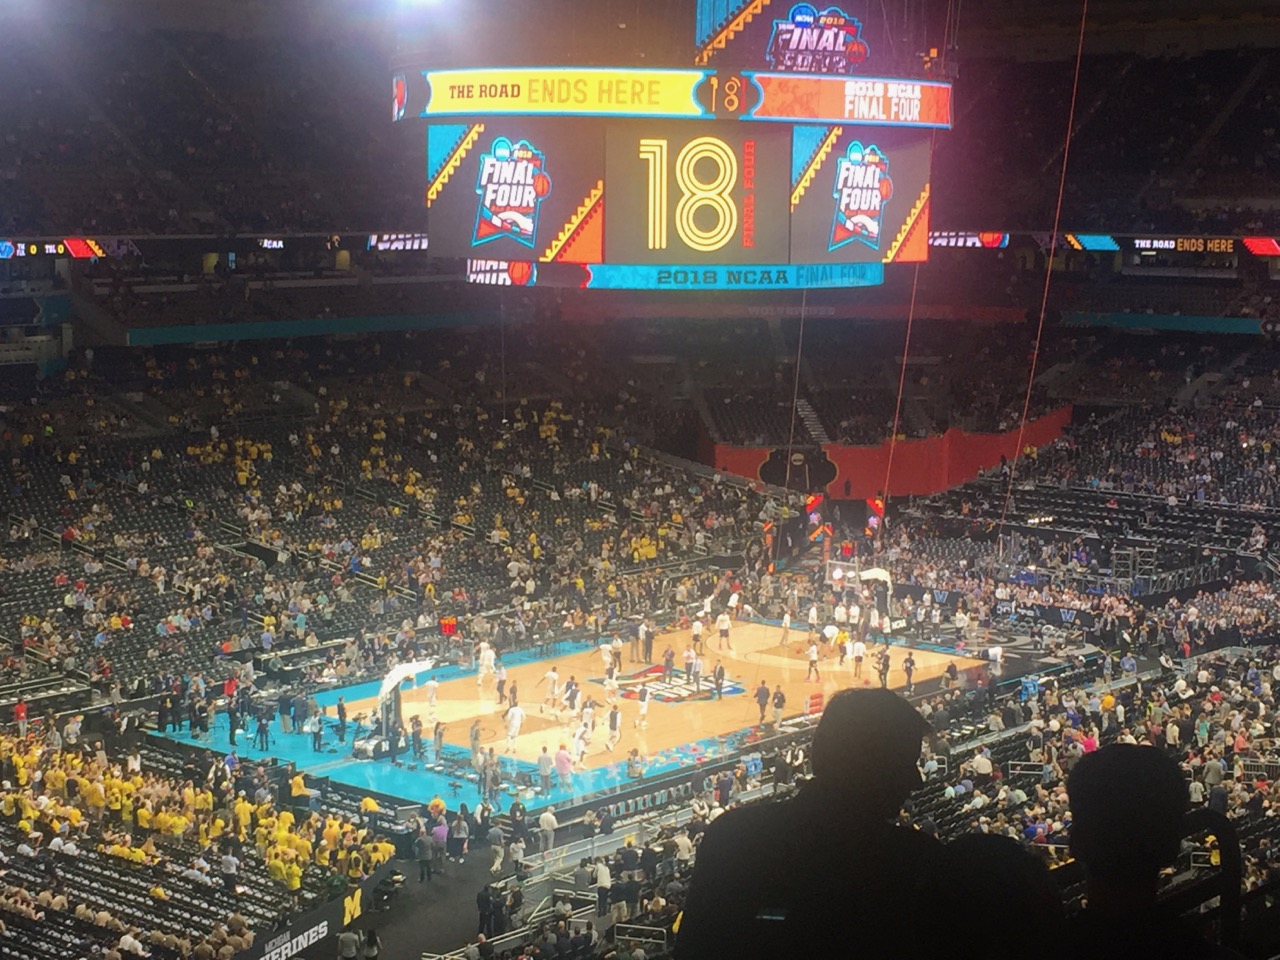
The temporary center-hung scoreboard was able to play video programming onto the court surface.

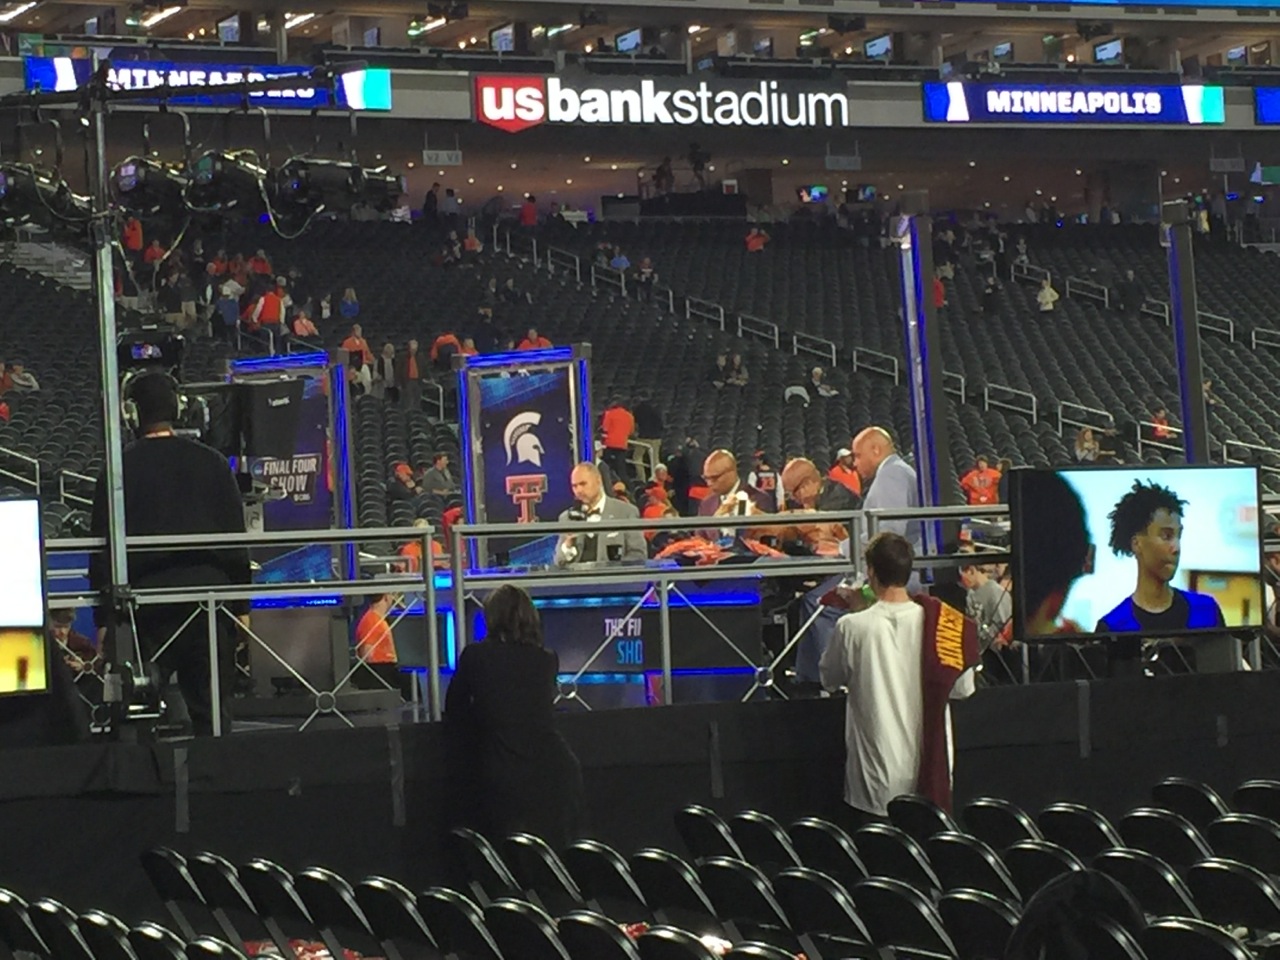
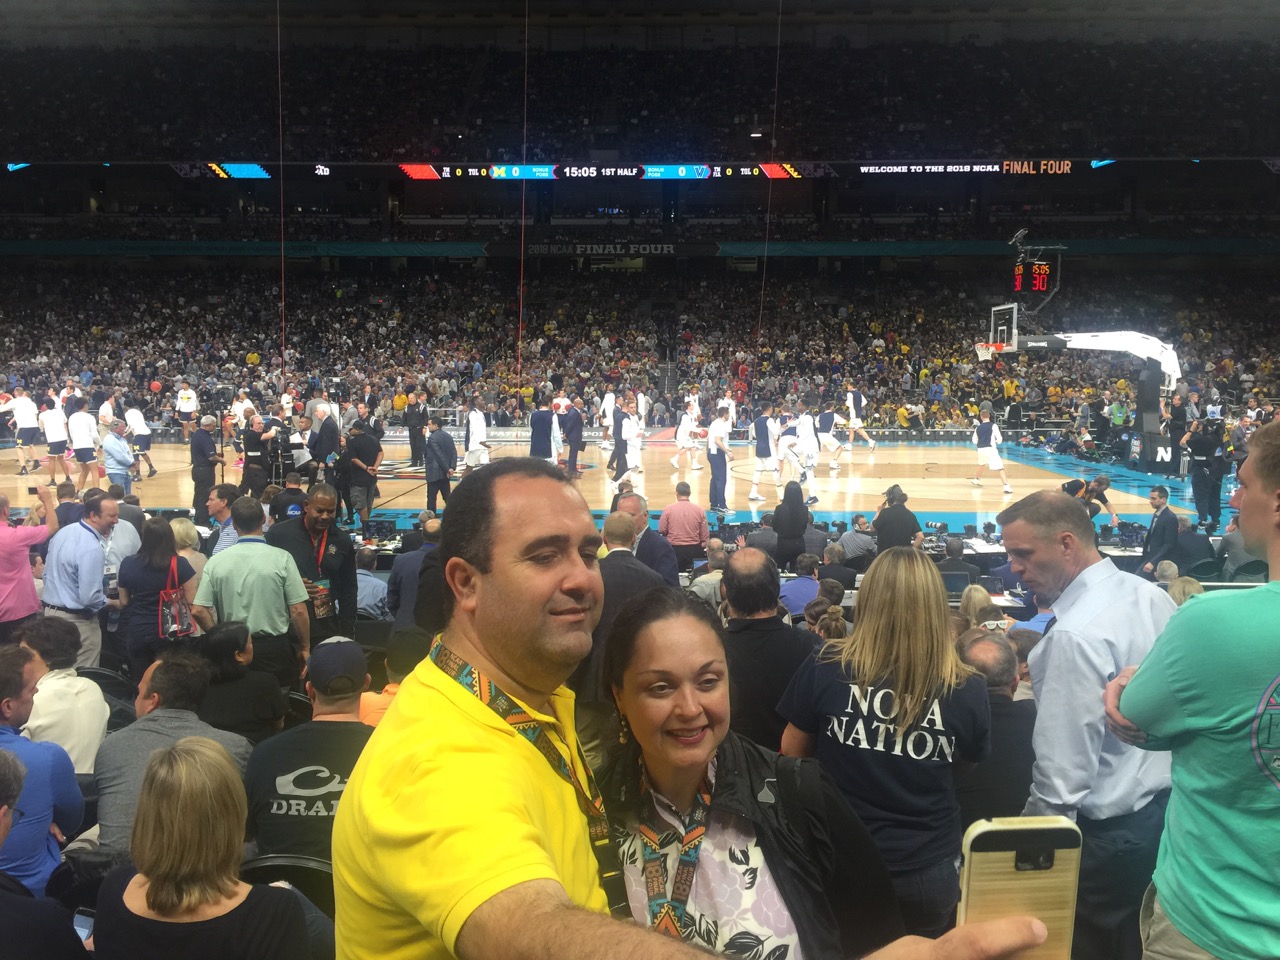
The NBA on TBS crew was courtside for the Final Four.

The secret to keeping your network operations room running? All kinds of energy inputs.

AT&T sees 2.5 TB of DAS traffic at men’s Final Four championship game

The concourses at U.S. Bank Stadium were well covered by DAS and Wi-Fi antennas for the recent Final Four. Credit: Paul Kapustka, MSR

In addition to the big Wi-Fi numbers seen at the NCAA men’s 2019 basketball championship game, AT&T said it saw 2.5 terabytes of data used by its customers on its DAS network at U.S. Bank Stadium in Minneapolis for the final game of the men’s Final Four weekend.

The neutral-host DAS in U.S. Bank Stadium, which is operated by Verizon, tested strong during MSR’s visit to the Final Four — we saw a mark of 37.5 Mbps on the download and 45.0 Mbps on the upload during the championship game, on a Verizon phone. Verizon, however, declined to provide any data totals from the Final Four.

In addition to its championship game numbers, AT&T said it saw 44.6 TB of data used on its networks in and around U.S. Bank Stadium for the entire men’s Final Four weekend.

Women’s Final Four sees 1.1 TB of DAS

At the NCAA women’s Final Four weekend in Tampa, Fla., AT&T said it saw a total of 1.1 TB of traffic used by its customers on the new MatSing Ball-powered DAS at Amalie Arena. That number includes traffic from both semifinal games as well as the championship game on April 7.

U.S. Bank Stadium sees 31.2 TB of Wi-Fi data used during Final Four weekend

The Final Four generated record Wi-Fi totals this year at U.S. Bank Stadium in Minneapolis. Credit all photos: Paul Kapustka, MSR (click on any picture for a larger image)

Fans at this year’s NCAA Men’s Final Four basketball tournament at U.S. Bank Stadium in Minneapolis used more than 31 terabytes of data on the Wi-Fi network during the championship weekend, with stadium records set in total single-day Wi-Fi usage and sustained data rates, and overall records set for concurrent connections and unique connections, according to figures from the NCAA.

The semifinal matches on April 6 between Auburn and Virginia and Texas Tech and Michigan State saw fans use the second-highest single-day Wi-Fi total we have seen reported, with 17.8 TB of data used. The Wi-Fi total surpassed the 16.31 TB of Wi-Fi data used in the same stadium during Super Bowl 52 on Feb. 4, 2018; only Super Bowl 53 this year at Mercedes-Benz Stadium in Atlanta, with 24.05 TB of Wi-Fi used, has seen a bigger data day (according to our unofficial list of such data events).

According to the NCAA figures, the network saw 51,227 unique users on Final Four Saturday, out of 72,711 in attendance. The 70 percent take rate just beats the 69 percent take rate seen at Super Bowl 53, an overall sign perhaps that bucket-event fans are increasingly turning to stadium Wi-Fi for connectivity. At Super Bowl 52 in U.S. Bank Stadium, there were 40,033 unique users on the Wi-Fi network (out of 67,612 in attendance), a take rate of 59 percent.

A familiar scene at the FInal Four — a fan recording their experience

The peak concurrent user number from Final Four Saturday of 31,141 was also an overall record, beating Super Bowl 53’s mark of 30,605. (Super Bowl 53 had 70,081 fans in attendance for the Feb. 3 game between the New England Patriots and the Los Angeles Rams.) The Wi-Fi network numbers for Monday’s championship game (won by Virginia 85-77 over Texas Tech in overtime) saw big numbers itself, with 13.4 TB of total data used, and 48,449 unique connections and 29,487 peak concurrent users (out of 72,062 in attendance). Monday’s game also produced a peak throughput number of 11.2 Gbps just after the game ended. The total official Wi-Fi data used during the semifinals and final was 31.2 TB.

According to stadium network officials, there were 1,414 active Cisco access points for the Final Four games, with some permanent Wi-Fi APs not being used because they were covered by the temporary seats that extended out to the court built in the middle of where the football field usually is. However, the temporary seating was covered by an additional 250 APs and 50-plus switches in a temporary network built by AmpThink and the stadium network team (look for a deeper profile of the temporary network in our upcoming Summer STADIUM TECH REPORT issue!).

Speed tests taken by Mobile Sports Report showed robust Wi-Fi connectivity all around the venue on both days, with marks like a 48.6 Mbps download and 44.0 Mbps upload in the higher seating section during pregame for Saturday’s events, another mark of 45.3 Mbps / 38.7 Mbps on the third-level main concourse close to Saturday’s tipoff, and a mark of 54.8 Mbps / 38.3 Mbps on the main lower-level concourse just after tipoff of Monday’s championship game.

One of the temporary seating under-seat Wi-Fi APs

“The traffic we experience on Wi-Fi networks at the Final Four is considerable each year, and Minneapolis was no exception,” said David Worlock, director of media coordination and statistics for the NCAA tournament. “We were completely satisfied with the performance of the network throughout the weekend.”

THE MSR TOP 20 FOR WI-FI

1. Super Bowl 53, Mercedes-Benz Stadium, Atlanta, Ga., Feb. 3, 2019: Wi-Fi: 24.05 TB
2. NCAA Men’s 2019 Final Four semifinals, U.S. Bank Stadium, Minneapolis, Minn., April 6, 2019: Wi-Fi: 17.8 TB
3. Super Bowl 52, U.S. Bank Stadium, Minneapolis, Minn., Feb. 4, 2018: Wi-Fi: 16.31 TB
4. NCAA Men’s 2019 Final Four championship, U.S. Bank Stadium, Minneapolis, Minn., April 8, 2019: Wi-Fi: 13.4 TB
5. 2018 College Football Playoff Championship, Alabama vs. Georgia, Mercedes-Benz Stadium, Atlanta, Ga., Jan. 8, 2018: Wi-Fi: 12.0 TB*
6. Super Bowl 51, NRG Stadium, Houston, Feb. 5, 2017: Wi-Fi: 11.8 TB
7. Atlanta Falcons vs. Philadelphia Eagles, Lincoln Financial Field, Philadelphia, Pa., Sept. 6, 2018: Wi-Fi: 10.86 TB
8. Super Bowl 50, Levi’s Stadium, Santa Clara, Calif., Feb. 7, 2016: Wi-Fi: 10.1 TB
9. Taylor Swift Reputation Tour, Gillette Stadium, Foxborough, Mass., July 27, 2018: Wi-Fi: 9.76 TB
10. Minnesota Vikings vs. Philadelphia Eagles, NFC Championship Game, Lincoln Financial Field, Philadelphia, Pa., Jan. 21, 2018: Wi-Fi: 8.76 TB
11. Jacksonville Jaguars vs. New England Patriots, AFC Championship Game, Gillette Stadium, Foxborough, Mass., Jan. 21, 2018: Wi-Fi: 8.53 TB
12. Taylor Swift Reputation Tour, Broncos Stadium at Mile High, May 25, 2018: Wi-Fi: 8.1 TB
13. Kansas City Chiefs vs. New England Patriots, Gillette Stadium, Foxborough, Mass., Sept. 7, 2017: Wi-Fi: 8.08 TB
14. SEC Championship Game, Alabama vs. Georgia, Mercedes-Benz Stadium, Atlanta, Ga., Dec. 1, 2018: Wi-Fi: 8.06 TB*
15. Green Bay Packers vs. Dallas Cowboys, Divisional Playoffs, AT&T Stadium, Arlington, Texas, Jan. 15, 2017: Wi-Fi: 7.25 TB
16. Stanford vs. Notre Dame, Notre Dame Stadium, South Bend, Ind., Sept. 29, 2018: 7.19 TB
17. (tie) Southern California vs. Notre Dame, Notre Dame Stadium, South Bend, Ind., Oct. 21, 2017: 7.0 TB
Arkansas State vs. Nebraska, Memorial Stadium, Lincoln, Neb., Sept 2, 2017: Wi-Fi: 7.0 TB
18. WrestleMania 32, AT&T Stadium, Arlington, Texas, April 3, 2016: Wi-Fi: 6.77 TB
19. Wisconsin vs. Nebraska, Memorial Stadium, Lincoln, Neb., Oct. 7, 2017: Wi-Fi: 6.3 TB
20. Super Bowl 49, University of Phoenix Stadium, Glendale, Ariz., Feb. 1, 2015: Wi-Fi: 6.23 TB

* = pending official exact data

Wi-Fi scores like Villanova during Final Four at Alamodome

Confetti rains down from the scoreboard after Villanova beat Michigan in this year’s Final Four championship game at the Alamodome in San Antonio, Texas. Credit all photos: Paul Kapustka, MSR (Click on any photo for a larger image)

SAN ANTONIO, Texas — The new and temporary Wi-Fi networks inside the Alamodome were as hot as national champion Villanova Monday night, with many speedtest marks in the 50-60 Mbps range for both download and upload throughout many points in the stadium.

We’ll have more details and perhaps some final tonnage numbers coming soon, but before we crash late night here in the Alamo city, where Mobile Sports Report was live in attendance at Monday night’s championship game of the NCAA Men’s Basketball Tournament, we wanted to share some impressive stats we saw while logging numerous steps up and down the sections of the venerable Alamodome before and during Villanova’s 79-62 victory over Michigan.

It was a pretty packed house with 67,831 in attendance Monday night, and for Wi-Fi it really was a tale of two networks: One, for the fixed or permanent seating in the football-sized facility, and another for the temproary network that serviced the wide expanse of floor seating brought in by the NCAA for its crown jewel event of men’s hoops. With about 200-plus Wi-Fi APs serving the closest seating sections, we still saw some super-healthy speedtest readings, like one of 55.9 Mbps download and 58.7 Mbps upload in the north stands in row DD, just past the band section and media sections behind the north hoop.

A good look at the court from the north end on the 300 level concourse

At center court on the side where the network broadcast teams sit, we got a speedtest of 34.3 Mbps down and 34.3 Mbps up in row JJ of section 112. Since we thought we heard Jim Nantz calling our name during pregame activities we scrambled down to row J, but Jim was called away before we could confirm his question. Instead we took a speed test there in the celeb seats and got an official mark of 1.65 Mbps / 7.61 Mbps, but did see a 10 Mbps download mark appear on a second test before the speedtest app encountered an error.

As far as we could tell, whatever designer and deployer AmpThink did for the on-floor seats it seemed to work pretty well. But as we are writing this that network is being dismantled, perhaps not to be used again until next year’s men’s Final Four, scheduled to take place at U.S. Bank Stadium in Minneapolis.

Handrail enclosures and Gillaroos

Up in the permanent seats, the network AmpThink installed during a permanent renovation of the Alamodome earlier also performed well, even in some of the hardest places to reach. At the top of the lower-bowl seating section, where MSR took a peanut break in the first half (since our media seat was, ironicially, the only place in the stadium where we couldn’t get any kind of a Wi-Fi connection) we got a mark of 65.6 Mbps / 62.5 Mbps.

A handrail Wi-Fi AP enclosure in one of the higher seating sections.

But even when we climbed into serious nosebleed country — and we do mean climb since the Alamodome has no escalators anywhere for fans — we still got good Wi-Fi connectivity, thanks in part to some handrail AP enclosures we saw above the VOMs leading to the top-section seats, and some Gillaroo antennas on the upper back walls pointing down. Above the VOM leading to section 343 in the stadium’s northwest corner we got a mark of 30.5 Mbps / 20.8 Mbps, and up near the roof in row 22 of section 342 we still got a mark of 17.5 Mbps / 9.84.

Other places where coverage really shined was in the stairwells and on the concourses; along the top-level 300 section concourse we got a pregame mark of 57.1 Mbps / 58.2 Mbps even as crowds chanting “Go Blue!” and “Nova Nation!” made traffic an elbow-to-elbow affair. In another stairwell, we stopped to catch our breath and got a speed test of 64.9 Mbps / 68.2 Mbps.

Overall, the permanent and temporary networks seemed to have performed well under the pressure of a bucket-list event, the kind where fans roam the concourses during pregame with phones overhead, taking videos to be shared later. According to Nicholas Langella, general manager for the Alamodome, preliminary reports said there were 12,500 unique connections to the Wi-Fi during Saturday’s semifinal games and another 12,300 connections during Monday’s championship game. On the DAS side of things, AT&T reported 2 terabytes of data used on their network during Saturday’s semifinals, and another 1.1 TB used during Monday’s game. We are still waiting for other carriers to report DAS numbers, as well as for final total Wi-FI usage numbers. For now enjoy some more photos from our visit.


Approaching the Alamodome from the freeway

A good look at how the NCAA floor seats extend out in the end zone area

Another look at the floor seating sections, this time along courtside

Courtside is selfie city

Gillaroos on overhangs in the permanent seating section

Zoomed in for a good look at the court

The human eye view from the same spot

Picture taking is the primary activity pregame

In case you forgot which event you came to see

Final Four final score: 17.6 TB (at least) of wireless data used at University of Phoenix Stadium

We finally have the Wi-Fi numbers from the NCAA men’s basketball tournament Final Four weekend at the University of Phoenix Stadium, and they are big — a total of 11.2 terabytes of data used during the two days of competition, according to the stadium network crews running the operations for the NCAA. Combined with AT&T’s reported DAS total of 6.4 TB, that means the total wireless usage so far is at least 17.6 TB — and that’s not including DAS numbers from Verizon Wireless, Sprint or T-Mobile, which if we had them would probably push the total far higher.

Just on the Wi-Fi side of things, the Saturday semifinal games this year produced enough single-day traffic (6.3 TB) to sneak into our unofficial Top 5 list for Wi-Fi events, barely edging Super Bowl XLIX, which saw 6.2 TB of traffic in the same building a couple years earlier. Granted, the Final Four has more fans in attendance and more time with two games compared to one, but it’s still a sign (to us, anyway) that wireless use by fans at big games of all types is continuing to grow. (It’s cool to see the comparison between a Super Bowl and a Final Four in the same venue, as well. Looks like the network operators there keep improving from big game to big game.)

According to the network stats provided to us, the Final Four crowd on Saturday saw 38,520 unique users connected to the Wi-Fi at some point, with a max concurrent user total of 20,675. On Monday night’s championship game, those numbers were 31,458 uniques and 19,861 max concurrent users. Attendance for the two sessions was 77,612 for Saturday’s semifinals and 76,168 for Monday’s championship, which were both second-highest ever numbers, according to a cool NCAA infographic that has some more stats on TV and internet viewership.

See you next year in San Antonio, NCAA… to see if the connectivity pace keeps increasing!

THE NEW TOP 8 FOR WI-FI

1. Super Bowl 51, NRG Stadium, Houston, Feb. 5, 2017: Wi-Fi: 11.8 TB
2. Super Bowl 50, Levi’s Stadium, Santa Clara, Calif., Feb. 7, 2016: Wi-Fi: 10.1 TB
3. Green Bay Packers vs. Dallas Cowboys, Divisional Playoffs, AT&T Stadium, Arlington, Texas, Jan. 15, 2017: Wi-Fi: 7.25 TB
4. WrestleMania 32, AT&T Stadium, Arlington, Texas, April 3, 2016: Wi-Fi: 6.77 TB
5. NCAA Men’s Final Four, University of Phoenix Stadium, Glendale, Ariz., April 1, 2017: Wi-Fi: 6.3 TB
6. Super Bowl 49, University of Phoenix Stadium, Glendale, Ariz., Feb. 1, 2015: Wi-Fi: 6.23 TB
7. Alabama vs. Texas A&M, Kyle Field, College Station, Texas, Oct. 17, 2015: Wi-Fi: 5.7 TB
8. Pittsburgh Steelers vs. New England Patriots, AFC Championship Game, Gillette Stadium, Foxborough, Mass., Jan. 22, 2017: Wi-Fi: 5.11 TB

AT&T: Fans used 2.28 TB of cellular data during Sweet 16 and Elite 8 games

Screen Shot 2016-03-31 at 11.45.34 AMAs the march toward the Final Four continued, fans at the Sweet 16 and Elite 8 venues for the men’s NCAA basketball tournament used a combined 2.28 terabytes of data on the AT&T networks in those venues, according to AT&T. The highest weekend total came from games at the Wells Fargo Center in Philadelphia, where 680 GB were used, according to AT&T.

Combined with the 3.6 TB of data AT&T said was used on its networks at first- and second-round sites, that makes a total of 5.88 TB used so far on AT&T cellular and DAS networks at the various hoops arenas. We’d like to hear from other carriers as well, but none have contacted us so far.

Data totals at this weekend’s Final Four in Houston should be interesting, since the host venue, NRG Stadium, doesn’t yet have a Wi-Fi network. Both AT&T and Verizon have beefed up cellular coverage in and around the arena, but without Wi-Fi it may be hard for fans to top last year’s total of 11 TB used at the Final Four at Lucas Oil Stadium in Indianapolis.

Remember — all Final Four games this weekend are on TBS, not CBS! Of course you can also stream the games if that’s easier.

https://alhikamsurabaya.sch.id/wp-content/slot-thailand/

https://mtsnupakis.sch.id/wp-content/bonus-new-member/

https://smptagsby.sch.id/wp-content/slot-bet-200/

https://lookahindonesia.com/wp-content/bonus-new-member/

https://sd-mujahidin.sch.id/wp-content/depo25-bonus25/

https://ponpesalkhairattanjungselor.sch.id/wp-content/mahjong-slot/

https://mtsnupakis.sch.id/wp-content/slot777/

https://sdlabum.sch.id/wp-content/slot777/

https://sdlabumblitar.sch.id/wp-content/bonus-new-member/

https://sdlabumblitar.sch.id/wp-content/spaceman/

https://paudlabumblitar.sch.id/wp-content/spaceman/