Notre Dame sees 6.1 TB of Wi-Fi for Michigan game

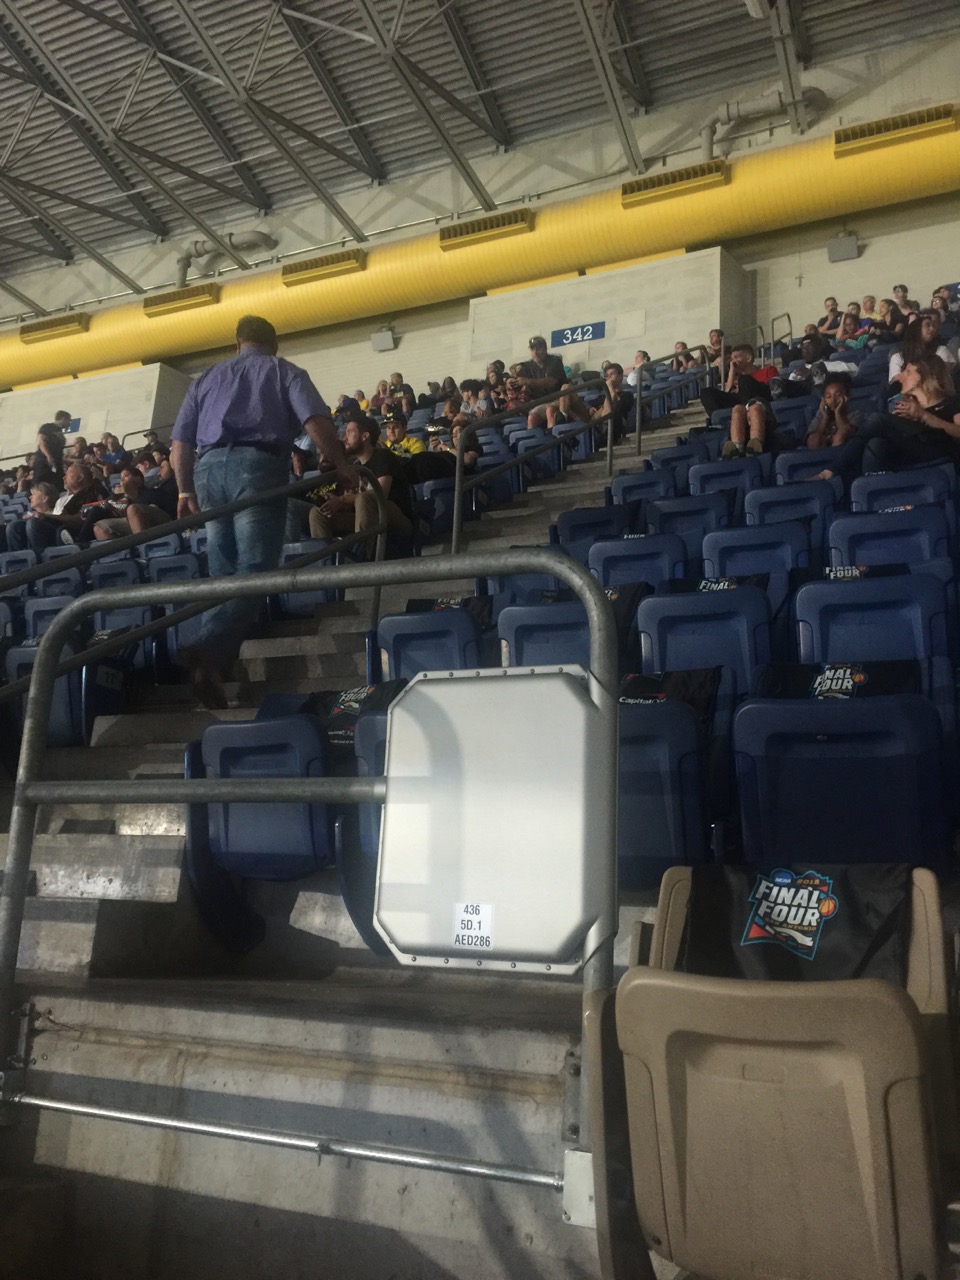
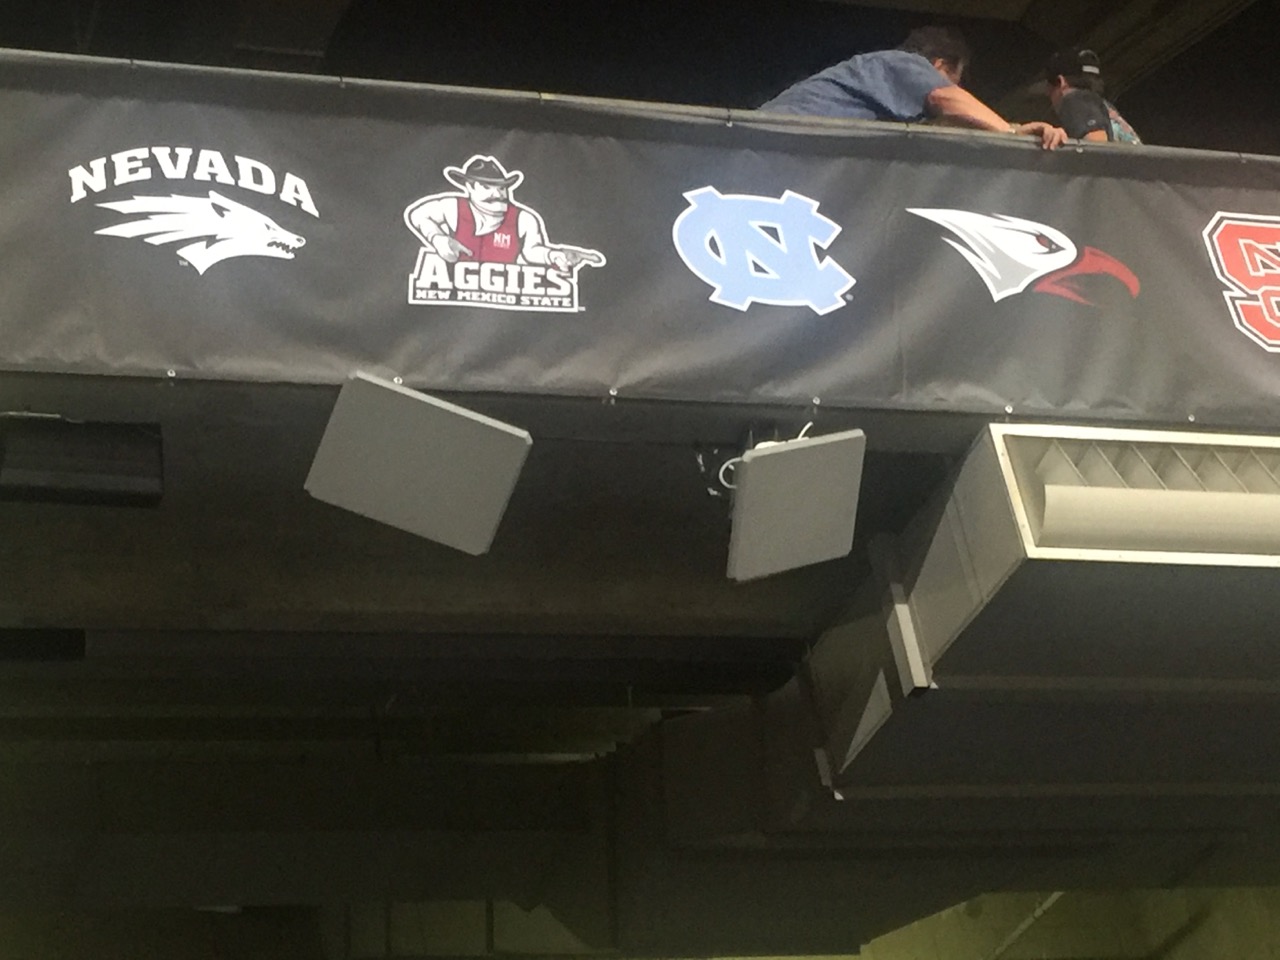
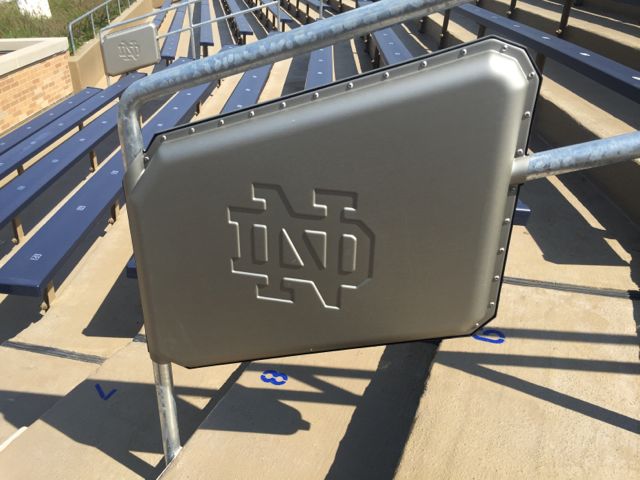
Wi-Fi enclosure on a railing at Notre Dame Stadium. Credit: Paul Kapustka, MSR

Though it just missed making our all-time unofficial top 10 list, the Wi-Fi data total from Notre Dame’s home and season opener against Michigan still saw 6.1 terabytes of Wi-Fi data used, signifying perhaps that user demand for wireless bandwidth at big sporting events remains as strong as ever.

The Sept. 1 game at Notre Dame Stadium, a 24-17 Notre Dame victory, also saw 29,329 unique connections on the Wi-Fi network, according to statistics provided to MSR by Notre Dame. With an announced attendance of 77,622 at the game, that’s a take rate of almost 38 percent.

Notre Dame also said that it saw 22,568 peak concurrent clients on the Wi-Fi network, and had a peak throughput of 7.66 Gbps. The 6.1 TB total data use is the third-highest at Notre Dame Stadium since its AmpThink-designed Wi-Fi network (using Cisco gear) debuted last season, trailing a 6.2 TB mark recorded in a game against Georgia and a 7.0 TB mark for a game against USC.

Looking ahead, Notre Dame’s network has a possibility for big numbers when currently ranked Stanford comes to Notre Dame on Sept. 29, or when Florida State visits on Nov. 10. Anyone else with numbers to report for the new season? The list stands ready for new entrants!

THE MSR TOP 10 FOR WI-FI

1. Super Bowl 52, U.S. Bank Stadium, Minneapolis, Minn., Feb. 4, 2018: Wi-Fi: 16.31 TB
2. Super Bowl 51, NRG Stadium, Houston, Feb. 5, 2017: Wi-Fi: 11.8 TB
3. Super Bowl 50, Levi’s Stadium, Santa Clara, Calif., Feb. 7, 2016: Wi-Fi: 10.1 TB
4. Minnesota Vikings vs. Philadelphia Eagles, NFC Championship Game, Lincoln Financial Field, Philadelphia, Pa., Jan. 21, 2018: Wi-Fi: 8.76 TB
5. Kansas City Chiefs vs. New England Patriots, Gillette Stadium, Foxborough, Mass., Sept. 7, 2017: Wi-Fi: 8.08 TB
6. Green Bay Packers vs. Dallas Cowboys, Divisional Playoffs, AT&T Stadium, Arlington, Texas, Jan. 15, 2017: Wi-Fi: 7.25 TB
7. (tie) Southern California vs. Notre Dame, Notre Dame Stadium, South Bend, Ind., Oct. 21, 2017: 7.0 TB
Arkansas State vs. Nebraska, Memorial Stadium, Lincoln, Neb., Sept 2, 2017: Wi-Fi: 7.0 TB
8. WrestleMania 32, AT&T Stadium, Arlington, Texas, April 3, 2016: Wi-Fi: 6.77 TB
9. Wisconsin vs. Nebraska, Memorial Stadium, Lincoln, Neb., Oct. 7, 2017: Wi-Fi: 6.3 TB
10. Super Bowl 49, University of Phoenix Stadium, Glendale, Ariz., Feb. 1, 2015: Wi-Fi: 6.23 TB

Final Four sees 9.97 TB of data used on Alamodome Wi-Fi

Fans at the Alamodome using mobile devices before the big game. Credit all photos: Paul Kapustka, MSR (click on any photo for a larger image)

The final stats are in, and this year’s men’s NCAA basketball tournament Final Four weekend in San Antonio saw a total of 9.97 terabytes of data used on the Wi-Fi network inside the Alamodome, according to official NCAA network reports.

With 4.9 TB of traffic used during the Saturday semifinal games and 5.07 TB used during the Monday night final the Alamodome Wi-Fi mark fell a bit below the 11.2 TB of data use seen during the 2017 Final Four weekend at the University of Pacific Stadium in Glendale, Ariz. With about 10,000 more fans per game (attendance at last year’s two sessions was 77,612 for Saturday’s semifinals and 76,168 for Monday’s championship, which were both second-highest ever numbers) and a more mature network it’s not surprising that there was a dip in Wi-Fi usage; the somewhat smaller Alamodome had 67,831 in attendance for the Monday night championship game.

So far only AT&T has reported DAS stats from this year’s Final Four, with 2 TB used on Saturday and 1.1 TB used Monday. Last year in Glendale AT&T said it saw 6.4 TB of DAS use. We have asked Verizon and Sprint for numbers but so far have not yet gotten any replies. As a stated policy T-Mobile does not report data traffic numbers from big events.

In a slight change from the preliminary reports we got, the official numbers show that the Alamodome Wi-Fi network saw 19,557 unique devices connect to the network on Saturday, with a peak concurrent total that day of 12,387 devices. On Monday night those numbers were 17,963 unique connections and 12,848 peak concurrent connections. Peak throughput for the Wi-Fi network on Saturday was 2.1 Gbps, while on Monday the mark was 1.6 Gbps.

New Report: Wi-Fi scores at Final Four, Vegas Knights get more Wi-Fi, and more!

A live in-person report of the Wi-Fi network performance at this year’s Final Four is just the beginning of our latest STADIUM TECH REPORT, the ONLY in-depth publication created specifically for the stadium technology professional and the stadium technology marketplace.

Mobile Sports Report traveled this spring to San Antonio, Texas, to get a firsthand look at the new networks installed at the venerable Alamodome, including one new permanent Wi-Fi deployment and another specifically tailored for the temporary courtside seats the NCAA brings in for its crown jewel event of the men’s basketball season.

Download our free report to get the details on how this network was able to deliver a superb wireless experience to the almost 70,000 fans in attendance.

The report from San Antonio, however, is just the beginning of our content-rich Spring 2018 issue, which also contains another in-person review, this one of the updated Wi-Fi network at T-Mobile Arena, the home-ice castle for the NHL’s newest sensation, the Vegas Golden Knights. Prompted by the team’s somewhat unexpected on-ice success, the quick network upgrade is a great lesson on how to respond to fan-experience demands. And it’s all explained in the STADIUM TECH REPORT.

More Wi-Fi for Vegas Knights, new construction in LA

There’s also a profile of the new network that was part of the refurbishment of Minneapolis’ Target Center, home of the NBA’s Timberwolves, as well as a look at some innovative marketing programs combining digital signage and Wi-Fi for greater fan engagement. Our Terry Sweeney also provides a look at new venue construction and old venue remodels in Los Angeles, and we also have a full recap of the record-breaking Wi-Fi and DAS traffic at this year’s Super Bowl at U.S. Bank Stadium in Minneapolis — all available for free download from our site!

We’d like to take a quick moment to thank our sponsors, which for this issue include Mobilitie, JMA Wireless, Corning, Huber+Suhner, Cox Business, Boingo, Oberon and Aruba, a Hewlett Packard Enterprise company. Their generous sponsorship makes it possible for us to offer this content free of charge to our readers.

Wi-Fi scores like Villanova during Final Four at Alamodome

Confetti rains down from the scoreboard after Villanova beat Michigan in this year’s Final Four championship game at the Alamodome in San Antonio, Texas. Credit all photos: Paul Kapustka, MSR (Click on any photo for a larger image)

SAN ANTONIO, Texas — The new and temporary Wi-Fi networks inside the Alamodome were as hot as national champion Villanova Monday night, with many speedtest marks in the 50-60 Mbps range for both download and upload throughout many points in the stadium.

We’ll have more details and perhaps some final tonnage numbers coming soon, but before we crash late night here in the Alamo city, where Mobile Sports Report was live in attendance at Monday night’s championship game of the NCAA Men’s Basketball Tournament, we wanted to share some impressive stats we saw while logging numerous steps up and down the sections of the venerable Alamodome before and during Villanova’s 79-62 victory over Michigan.

It was a pretty packed house with 67,831 in attendance Monday night, and for Wi-Fi it really was a tale of two networks: One, for the fixed or permanent seating in the football-sized facility, and another for the temproary network that serviced the wide expanse of floor seating brought in by the NCAA for its crown jewel event of men’s hoops. With about 200-plus Wi-Fi APs serving the closest seating sections, we still saw some super-healthy speedtest readings, like one of 55.9 Mbps download and 58.7 Mbps upload in the north stands in row DD, just past the band section and media sections behind the north hoop.

A good look at the court from the north end on the 300 level concourse

At center court on the side where the network broadcast teams sit, we got a speedtest of 34.3 Mbps down and 34.3 Mbps up in row JJ of section 112. Since we thought we heard Jim Nantz calling our name during pregame activities we scrambled down to row J, but Jim was called away before we could confirm his question. Instead we took a speed test there in the celeb seats and got an official mark of 1.65 Mbps / 7.61 Mbps, but did see a 10 Mbps download mark appear on a second test before the speedtest app encountered an error.

As far as we could tell, whatever designer and deployer AmpThink did for the on-floor seats it seemed to work pretty well. But as we are writing this that network is being dismantled, perhaps not to be used again until next year’s men’s Final Four, scheduled to take place at U.S. Bank Stadium in Minneapolis.

Handrail enclosures and Gillaroos

Up in the permanent seats, the network AmpThink installed during a permanent renovation of the Alamodome earlier also performed well, even in some of the hardest places to reach. At the top of the lower-bowl seating section, where MSR took a peanut break in the first half (since our media seat was, ironicially, the only place in the stadium where we couldn’t get any kind of a Wi-Fi connection) we got a mark of 65.6 Mbps / 62.5 Mbps.

A handrail Wi-Fi AP enclosure in one of the higher seating sections.

But even when we climbed into serious nosebleed country — and we do mean climb since the Alamodome has no escalators anywhere for fans — we still got good Wi-Fi connectivity, thanks in part to some handrail AP enclosures we saw above the VOMs leading to the top-section seats, and some Gillaroo antennas on the upper back walls pointing down. Above the VOM leading to section 343 in the stadium’s northwest corner we got a mark of 30.5 Mbps / 20.8 Mbps, and up near the roof in row 22 of section 342 we still got a mark of 17.5 Mbps / 9.84.

Other places where coverage really shined was in the stairwells and on the concourses; along the top-level 300 section concourse we got a pregame mark of 57.1 Mbps / 58.2 Mbps even as crowds chanting “Go Blue!” and “Nova Nation!” made traffic an elbow-to-elbow affair. In another stairwell, we stopped to catch our breath and got a speed test of 64.9 Mbps / 68.2 Mbps.

Overall, the permanent and temporary networks seemed to have performed well under the pressure of a bucket-list event, the kind where fans roam the concourses during pregame with phones overhead, taking videos to be shared later. According to Nicholas Langella, general manager for the Alamodome, preliminary reports said there were 12,500 unique connections to the Wi-Fi during Saturday’s semifinal games and another 12,300 connections during Monday’s championship game. On the DAS side of things, AT&T reported 2 terabytes of data used on their network during Saturday’s semifinals, and another 1.1 TB used during Monday’s game. We are still waiting for other carriers to report DAS numbers, as well as for final total Wi-FI usage numbers. For now enjoy some more photos from our visit.


Approaching the Alamodome from the freeway

A good look at how the NCAA floor seats extend out in the end zone area

Another look at the floor seating sections, this time along courtside

Courtside is selfie city

Gillaroos on overhangs in the permanent seating section

Zoomed in for a good look at the court

The human eye view from the same spot

Picture taking is the primary activity pregame

In case you forgot which event you came to see

https://duwit.ukdw.ac.id/document/pengadaan/slot777/

https://mtsnupakis.sch.id/wp-content/zeusslot/

https://insankamilsidoarjo.sch.id/wp-content/slot-zeus/

https://smpbhayangkari1sby.sch.id/wp-content/slot-zeus/

https://alhikamsurabaya.sch.id/wp-content/slot-thailand/

https://mtsnupakis.sch.id/wp-content/bonus-new-member/

https://smptagsby.sch.id/wp-content/slot-bet-200/

https://lookahindonesia.com/wp-content/bonus-new-member/

https://ponpesalkhairattanjungselor.sch.id/wp-content/mahjong-slot/

https://mtsnupakis.sch.id/wp-content/slot777/

https://sdlabum.sch.id/wp-content/slot777/

https://sdlabumblitar.sch.id/wp-content/bonus-new-member/

https://sdlabumblitar.sch.id/wp-content/spaceman/

https://paudlabumblitar.sch.id/wp-content/spaceman/