All-Star Game has DAS Grand Slam: Four different DAS systems online at Great American Ball Park

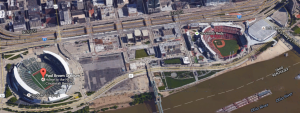
Google Map screenshot of Cincinnati riverfront area, showing Paul Brown Stadium and the Great American Ball Park. Somewhere in between is a DAS headend.

Google Map screenshot of Cincinnati riverfront area, showing Paul Brown Stadium and the Great American Ball Park. Somewhere in between is a DAS headend.

Call it the DAS grand slam — to cover wireless customer demand, the Great American Ball Park in Cincinnati has four separate DAS deployments, one for each of the major U.S. wireless carriers, which are probably all getting a workout at tonight’s Major League Baseball All-Star Game.

Brian Keys, vice president of technology for the Cincinnati Reds, confirmed Tuesday that there are four separate DAS (distributed antenna system) networks in the ballpark, one each for AT&T, Verizon Wireless, Sprint and T-Mobile. Through several interviews Mobile Sports Report was able to confirm that Solid is providing the gear for the Verizon DAS, and another source said that ADRF is providing the DAS for Sprint.

We also had a long interview with the folks at TE Connectivity, who initially installed a 2G/3G/4G DAS in the venue in 2011, and recently upgraded that DAS, adding support for the 2100 MHz AWS spectrum. And while TE Connectivity was not at liberty to name the carrier for which it provides the DAS, by process of elimination we are fairly confident that their customer is AT&T. T-Mobile, which is also on its own DAS in the park, is also believed to be a Solid customer but we haven’t yet confirmed that fact.

Why are there four systems in Cincinnati? We haven’t yet had a chance to talk to Brian Keys (he’s been a little bit busy this week) but it’s fairly likely that it was just a fairly normal occurrence in the DAS world — one big carrier doesn’t want to join a DAS already installed by another big carrier, so it just funds its own. At the Great American Ball Park, Verizon’s decision to build its own DAS may have been in part because the carrier already has a DAS headend facility nearby, serving Paul Brown Stadium, the GABP’s riverfront neighbor. In fact, the Solid folks told us Tuesday that both the baseball DAS and the football DAS for Verizon are served out of the same facility, which makes sense.

The TE Connectivity DAS, for the client it couldn’t name (AT&T!), was also recently upgraded to cover areas outside the stadium, including the parking lots, a trend we are seeing more of as venues realize that fans want connectivity the moment they arrive, not just when they’re in their seats. We’ll try to get more details on this somewhat unique DAS situation — which was also apparently approved by the technical and business folks at MLBAM, which helped bring a Wi-Fi upgrade to the park this past offseason — but for the meantime, let’s just be glad that customers of all four of the major U.S. carriers had DAS support at Tuesday’s All-Star Game — in their own private and separate ways.
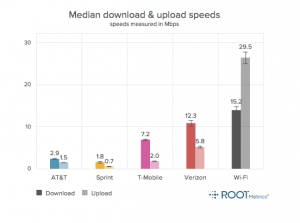
RootMetrics debuts tests of cell service inside stadiums

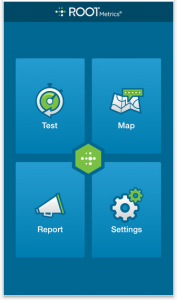
Screen shot of RootMetrics reporting app.

Screen shot of RootMetrics reporting app.

RootMetrics, a Bellevue, Wash.-based concern that has made a name for itself by conducting tests of wireless services in cities and airports across the nation, is now starting to test wireless networks in sports stadiums, which may give fans a heads-up on how their provider is performing inside stadium walls.

Though it only has visited a handful of arenas so far, RootMetrics eventually plans to test more than 100 stadiums this year, according to the company. For each venue, RootMetrics sends an unspecified number of testers to track data performance of the top four wireless carriers in the U.S., a list that includes AT&T, Verizon Wireless, Sprint and T-Mobile. RootMetrics’ venue testers also check performance of the internal Wi-Fi network if one is available, but it does not let Wi-Fi compete for its “RootScore Award,” which it bestows upon the carrier with best performance in the combined categories of speed and “data reliability,” basically a measurement of the ability to make and hold a connection during any wireless data request or action.

RootMetrics also doesn’t take into account whether or not any of the carriers has preferential deals inside a venue, which may give that provider a leg up on the competition. For its report on the Staples Center, for instance, RootMetrics gives its award to Verizon, which is not surprising to us since Verizon built both the Wi-Fi and the DAS network at the facility. But RootMetrics makes no mention of the business agreements at Staples or anywhere else, which is by design, according to the company.

Why can’t Wi-Fi win?

RootMetrics CEO Bill Moore said in a recent phone interview that such details about contracts and preferred suppliers really don’t matter to consumers — what really matters, he said, is how well each carrier performs in the venue.

While the “scoreboard” mentality does perform a service by presenting just what data the testers find, the RootMetrics venue surveys have some gaps that may need to be filled or changed in the future to present a fully accurate picture of stadium network performance. One big reporting gap is the fact that RootMetrics doesn’t use any iOS devices in its stadium tests, a strange omission since most stadium networks say they still see a majority of iPhones among the devices being used on stadium networks. RootMetrics also seems to unfairly leave Wi-Fi networks out of the scoring, even though in many cases so far the local Wi-Fi networks far outperform the carrier cellular links.

Screen shot of RootMetrics' test results for the Moda Center in Portland.

Screen shot of RootMetrics’ test results for the Moda Center in Portland.

For Portland’s Moda Center, for instance, RootMetrics gives its RootScore award to Verizon, since in their testing Verizon was found to have better data reliability and better data speeds than the other cellular carriers. But the stadium’s in-house Wi-Fi network was 3 Mbps faster than Verizon on the download side and more than five times faster than Verizon on the upload side — yet Wi-Fi wasn’t mentioned in the venue “scores” and only got a footnote at the bottom of the results page.

Founded in 2008, RootMetrics has (apparently) built a good business in its chosen field, since it was acquired last month by the Englewood, Colo.-based IHS, a large information and analytics concern that recorded $546 million in revenue for its most recent quarter.

In the industry, RootMetrics is well known for its wireless coverage performance map and its “RootScores,” which attempt to determine winners and losers in the wireless service game for major U.S. metropolitan areas and the nation’s busiest airports. The basic RootMetrics premise is that they measure exactly what service levels consumers see in real life, providing an independent way for customers to evaluate services in a given area. While consumers can see the high-level results of its tests — which include both internal testing as well as data “crowdsourced” from consumers who download the RootMetrics reporting app — RootMetrics also sells its information directly to carriers and other infrastructure providers.

Stadium Tech Report: Los Angeles Angels and 5 Bars build ‘wireless halo’ of Wi-Fi & DAS for Angels Stadium

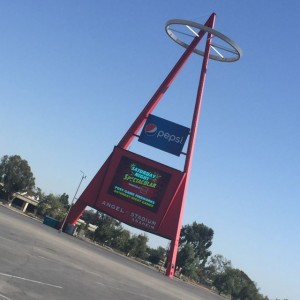
The iconic sign outside the "Big A," aka Angels Stadium of Anaheim. Credit all photos, even tilted ones: Terry Sweeney, MSR (click on any photo for a larger image)

The iconic sign outside the “Big A,” aka Angels Stadium of Anaheim. Credit all photos, even tilted ones: Terry Sweeney, MSR (click on any photo for a larger image)

Every baseball team wants to notch a win on opening day, and the Los Angeles Angels of Anaheim are no exception. So while the number of runs scored was important to Al Castro, the franchise’s IT director, his eye was also on wireless performance in Angels Stadium, since 2015 will be the first full season with both Wi-Fi and DAS technology in place. The Angels may have lost their opener against the Kansas City Royals, but their wireless networks scored big by handling more than 1.3 TB of data that afternoon.

“Fans expect connectivity these days,” Castro told Mobile Sports Report during a tour of Angels Stadium, aka the Big A, which was built in 1966. Once the home of the NFL’s Los Angeles Rams, the stadium went through and extensive renovation in 1997-98 and now seats about 44,000 for baseball and serves 3 million visitors annually. “If they’re going to come to a ballgame for four hours,” said Castro of today’s fans, “they won’t tolerate not being connected.”

Adding wireless to the ‘Big A’

To get the wireless ball rolling last year, teams of engineers on scaffolding started on the uppermost tier of the Big A (the “View Level”) to mount DAS and Wi-Fi antennas to the stadium canopy. Working from outermost edges of the C-shaped stadium, two sets at of scaffolding at each end leapfrogged each til they met in the middle – a five-week process, according to Castro.

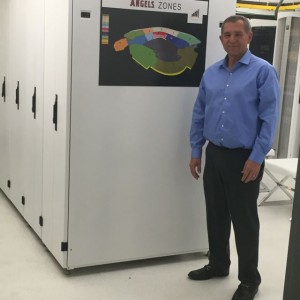
Angels IT director Al Castro, in front of his wireless deployment map

Angels IT director Al Castro, in front of his wireless deployment map

The 15-zone DAS network went live in June 2014 with Verizon, AT&T and T-Mobile on board; Sprint is expected to add some antennas in the next several weeks. Currently, there are 122 DAS remotes in 33 locations. Angel Stadium Wi-Fi went live in September 2014 and now counts more than 400 access points around the stadium, according to team figures. Ruckus Wireless is the Wi-Fi vendor; the DAS gear is from Teko Telecom, now part of JMA Wireless.

The Angels worked closely with technology partner 5 Bars, a builder of turnkey wireless networks for sports venues’ wireless needs. Castro would not disclose the budget for the wireless upgrades at Angels Stadium.

In addition to using Major League Baseball’s Ballpark app, Angels fans can post to social media, surf the Web and check email from the stadium’s wireless networks. On the stadium’s club level, spectators can wirelessly order food and beverage from their seats; Legends, which operates the stadium’s concessions, uses an unpublished SSID for 150 wireless-enabled moveable cash registers and more than two dozen handheld point-of-sale devices. Similarly, TicketMaster has its own invisible SSID for wireless scanning of tickets at the stadium’s entry gates; the SSID for the press box is also masked, according to Castro.

Hiding in plain (or painted) sight

The DAS antennas and APs have been strategically installed and well concealed; they’re as discrete as chameleons. Working with Ruckus gear, 5 Bars installed narrow-beam, sectorized-beam and high-capacity APs, all centrally managed by Ruckus’s SmartCell Gateway 200.

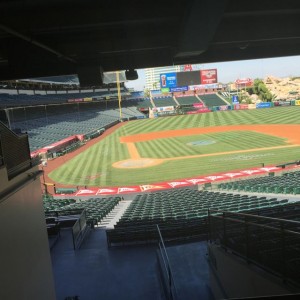
A nice view of the field -- with antennas in silhouette

A nice view of the field — with antennas in silhouette

The Angels also use SmartCell Insight, a reporting and analytics package that helps the team track number of unique connections to the Wi-Fi during the course of a game, device types, total and average data uploaded and downloaded, and their speeds, Castro said.

Angel Stadium Wi-Fi has been engineered for 20,000 simultaneous users; there’s no throttling of user bandwidth and no filtering for streaming media like Spotify — “yet,” Castro was quick to add with a laugh. Download speeds vary depending on crowd size, according to Tommy Taylor, senior manager, engineering services for 5 Bars. For a game with 36,000 in attendance, for example, average download speed for devices using 2.4 GHz bandwidth is 8-12 Mbps, while 5 GHz connections can run as fast as 18-24 Mbps. On the traffic side, currently the network is seeing upload volume of about 20 percent of the download average volume, Taylor said, in an email to Mobile Sports Report.

The Angels will continue to fine-tune the network and add or re-point APs as necessary. “We are in the process of adding additional APs to cover some areas that, when the stadium is full, do not receive the high level of coverage we are targeting to provide,” Castro said. Those additions should be done by mid-June. Management has an eye on monetizing the network through sponsorships, and extending the in-seat ordering system beyond the club level of the ballpark, according to Castro.

He also wants to add streaming video to the network so that fans can watch replay from multiple angles, which Castro described as “a good incentive — something you can’t get at home.” He also intends to expand his use of analytics and report generation on a game-by-game basis. It’s the sort of thing that the owners and managers of the team are increasingly interested in, Castro added.

Stadium Tech Report: Blazing a Trail to Connectivity at Portland’s Moda Center

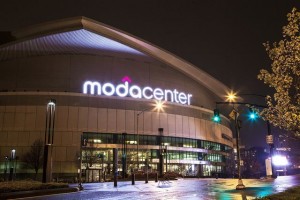
Portland's Moda Center, home of the NBA Trail Blazers. Credit all photos: Moda Center (click on any photo for a larger image)

Portland’s Moda Center, home of the NBA Trail Blazers. Credit all photos: Moda Center (click on any photo for a larger image)

When it comes time to build a stadium network there are two obvious choices of how to get it done: You let someone else build and run it, or do it yourself.

When neither of these options appealed to the Portland Trail Blazers and their planned networking upgrade at the Moda Center, they went with a third option: Using a neutral host provider for both DAS and Wi-Fi.

After turning to neutral host provider Crown Castle to build out the enhanced cellular DAS (distributed antenna system) network as well as a fan-facing Wi-Fi network, Portland’s home at the Moda Center now has a level of wireless connectivity that mirrors the team’s excellent on-court performance — challenging for the NBA lead and looking to keep improving.

With Wi-Fi gear from Aruba Networks and an app developed by YinzCam, fans at Trail Blazers games can use the stadium Wi-Fi to gain access to live-action video streams, player stats and even a radio broadcast of the game. The app also supports seat upgrades, a feature powered by Experience.

Now in its second year of existence, the network and all its attributes are a big hit with Portland fans, according to Vincent Ircandia, vice president for business analytics and ticket operations for the Trail Blazers, and Mike Janes, vice president of engineering and technology for the Trail Blazers.

“We do a lot of fan surveys, and the approval [for the network] continues to go up,” said Janes. “We want to figure out what we can do next.”

Third-party the third and correct choice

Editor’s note: This profile is part of our new Stadium Tech Report HOOPS AND HOCKEY ISSUE, available for free download. In addition to this story it contains additional profiles and team-by-team tech capsules for all 30 NBA teams. Download your copy today!

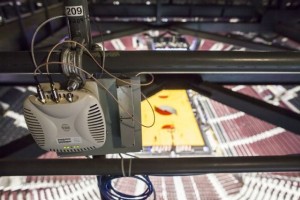
Aruba Wi-FI AP in the rafters at Moda Center

Aruba Wi-FI AP in the rafters at Moda Center

If you dial the clock hands back a few years you would find an arena in Portland with not much connectivity at all, and fans who made their displeasure over the situation known, loud and clearly.

“Trail Blazers fans are not shy about letting us know how they feel,” Ircandia said. “Two years ago we learned that fans didn’t have much connectivity here [at the Moda Center]. That was a real gap in the customer experience.”

Janes said the top two methods of bringing a network in — allowing a carrier to build and operate it, or to build and run it themselves — both had significant drawbacks.

“You could hand it over to a carrier [to be a neutral host] but I’ve seen that before, where one carrier has to ride on another carrier’s DAS,” Janes said. “That’s not a good solution.”

The DIY option, Janes said, would mean that the Trail Blazers team would have to build the networks themselves, and hire someone to manage it.

“That would mean we would have to deal with the [multiple] carriers directly, and we didn’t want to do that,” Janes said.

In the end, Portland went with the neutral host option, with Crown Castle building and running the DAS and installing a Wi-Fi network as well. With its wide experience in building and managing DAS deployments, Crown Castle already has AT&T and Verizon as tenants on the Moda Center DAS, with Sprint coming on soon and possibly T-Mobile joining in the near future.

And on the Wi-Fi side, the team itself “owns” the network and the associated data — “and that’s good, because we are starting to take deeper dives into that,” Janes said.

And how’s it all operating?

“No complaints [recently],” Janes said. “The fans are pretty quiet when it’s just working.”

User numbers flat, data use doubles

Maybe those users are quiet because they are busy posting pictures to Instagram or posts to Facebook, two of the leading applications being used at the Moda Center, according to the Trail Blazers. According to Ircandia, what’s interesting about the usage patterns from last year to this year is that while the number of fans using the network has remained fairly stable (at about 25 percent of attendees), the amount of wireless data consumed has just about doubled from last season to this season, meaning that people are doing more things on the network.

Toyota pregame show on the Moda Center concourse

Toyota pregame show on the Moda Center concourse

Some of that may have to do with a redesigned app, which added four live streams of video action, as well as live radio broadcast coverage.

“We didn’t leave [interaction] to chance,” Janes said. “We spent a lot of effort improving the app and redesigning the web presence to make it more enticing and robust.”

While having more features is always a good step, a big part of the challenge for any team is just getting fans to use the network and the team app. At Moda Center, there is a unique method of network promotion, which also directly benefits the team: By selling the “sponsorship” of the network to local-area Toyota dealers, the stadium operators now have a partner who actively promotes the network to fans walking into the building.

According to Ircandia, the Toyota dealers also sponsor a pregame show, set on the arena concourse with the team’s dancers in attendance to help attract attention. “They [Toyota] want to sell cars, so they have a lot of signage [about the network],” in addition to the show, Incardia said.

If there is such a thing as a good problem, there is one involving the ticket upgrade feature: Since the Trail Blazers have such passionate fans and are doing so well, there aren’t many available seats to offer for upgrades. “It’s a bit of a constrained inventory,” Janes said. Still, the team is using the Experience feature to offer last-minute ticket deals to students in the area, alerting them that there are seats available that may have a chance to be upgraded.

“They [students] have the time to drop whatever they’re doing to come over to the game,” Janes said.

Retrofitting an old flower

Previously known as the Rose Garden, the arena, which was built in 1995, clearly wasn’t initially designed with wireless connectivity in mind.

“We were retrofitting for technology that didn’t exist [when the building was built],” Ircandia said. “That’s where creativity comes in.”

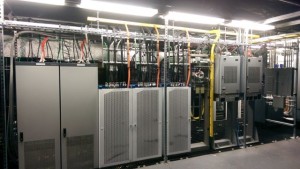
DAS headend gear

DAS headend gear

Some of the creativity in network design included separate Wi-Fi antennas for 2.4 GHz and 5 GHz transmissions, so that older devices didn’t have to compete with newer devices for the best Wi-Fi connection. Ircandia also said that the Moda Center “created” some new DAS headend space up in the highest reaches of the building.

“We built catwalks above the catwalks,” Ircandia said.

Looking ahead to what’s next, Janes said the network team is looking to use wireless to connect to food and beverage carts, so that point of sale operations don’t need to be tied to a plug in the wall.

“If we go wireless we can move the carts around, even put them outside, which gives us a business case improvement with no impact to the fans,” Janes said.

And now that those fans know what is possible, they will want what they have now, and more.

“That’s their expectation now,” Janes said, “that it will work when they walk in the building.”

Super Bowl XLIX sets new stadium Wi-Fi record with 6.2 Terabytes of data consumed

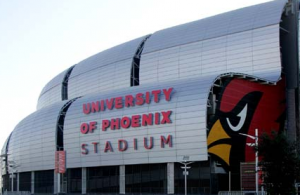
University of Phoenix Stadium. Credit: Arizona Cardinals.

University of Phoenix Stadium. Credit: Arizona Cardinals.

The Super Bowl is once again the stadium Wi-Fi champ, as fans at Sunday’s Super Bowl XLIX in Glendale, Ariz., used 6.23 terabytes of data during the contest, according to the team running the network at the University of Phoenix Stadium.

The 6.23 TB mark blew past the most recent entrant in the “most Wi-Fi used at a single-day single-stadium event” sweepstakes, the 4.93 TB used at the Jan. 12 College Football Playoff championship game at AT&T Stadium. Prior to that, pro football games this past season at Levi’s Stadium in Santa Clara, Calif., and at AT&T Stadium had pushed into the 3-plus TB mark to be among the highest totals ever reported.

The live crowd watching the New England Patriots’ 28-24 victory over the Seattle Seahawks also used about as much cellular data as well, with Verizon Wireless, AT&T and Sprint claiming a combined total of 6.56 TB used in and around the stadium on game day. All three carriers were on the in-stadium and outside-the-stadium DAS deployments being run by neutral host Crown Castle. If those figures are correct (more on this later) it would put the total wireless data usage for the event at 12.79 TB, far and away the biggest single day of wireless data use we’ve ever heard of.

Apple OS updates still the application king

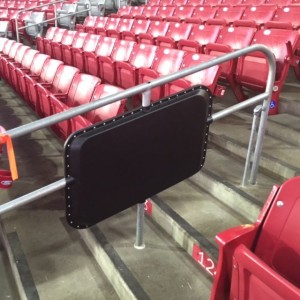
Handrails with Wi-Fi antenna enclosures from AmpThink. Credit: Arizona Cardinals.

Handrails with Wi-Fi antenna enclosures from AmpThink. Credit: Arizona Cardinals.

Mark Feller, vice president of information technology for the Arizona Cardinals, and Travis Bugh, senior wireless consultant for CDW, provided Mobile Sports Report with the final Wi-Fi usage numbers, which are pretty stunning for anyone in the stadium networking profession. According to Feller the new CDW-deployed Wi-Fi network with Cisco gear at the UoP Stadium saw 2.499 TB of data downloaded, and 3.714 TB uploaded, for a total of 6.213 TB of Wi-Fi usage. Bugh of CDW said there were 25,936 unique devices connecting to the network on game day, with a peak concurrent usage of 17,322, recorded not surprisingly at halftime.

Peak download usage of 1.3 Gbps was recorded before the game’s start, while peak upload usage of 2.5 Gbps was hit at halftime. The top applications by bandwidth use, Feller said, were Apple (mobile update), Facebook, Dropbox and Snapchat.

DAS numbers also set new record, but clarification needed

The only reason we aren’t yet trumpeting the 6.564 TB of reported DAS use as a verified record is due to the differences in clarity from each of the reporting providers. We also haven’t yet heard any usage totals from T-Mobile, so it’s likely that the final final wireless data use number is somewhere north of 13 TB, if all can be believed.

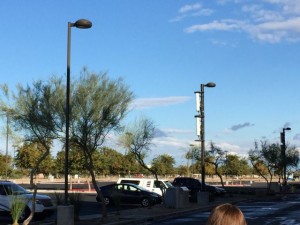
Parking lot light poles, Westgate entertainment district. Can you spot the DAS?

Parking lot light poles, Westgate entertainment district. Can you spot the DAS?

As reported before, AT&T said it saw 1.7 TB of cellular wireless activity from its customers on game day, with 696 GB of that happening inside the stadium, and the balance coming from the outside areas before and after the game. We’d also like to welcome Sprint to the big-game reporting crew (thanks Sprint!), with its total of 754 GB of all 4G LTE traffic used in and around the stadium on game day. According to Sprint representatives, its Super Bowl coverage efforts included 5 COWs (cell towers on wheels) as well as expanded DAS and macro placements in various Phoenix-area locations. The Sprint coverage included the 2.5 GHz spectrum that uses TDD LTE technology.

As also previously reported, Verizon Wireless claimed 4.1 TB of customer traffic in and around the stadium on game day, which Verizon claims is all cellular traffic and does not reflect any Verizon Wireless customer use of the stadium Wi-Fi network. Verizon also reported some other interesting activity tidbits, which included 46,772 Verizon Wireless devices used at the game, of which just 59.7 percent were smartphones. Verizon also said it saw 10 million emails sent on its networks that day, and 1.9 million websites visited, while also seeing 122.308 videos sent or received over wireless connections.

We’re still waiting to see if we can get usage numbers from the Super Bowl stadium app (we’re especially interested to see if the instant replay feature caught on) but the warning for stadium owners and operators everywhere seems to be clear: If you’re hosting the big game (or any BIG game), make sure your network is ready for 6 TB and beyond!

Super DAS, Part 2: Super Bowl stadium DAS expands to address increased demand for cellular connectivity

Editor’s note: This story is part 2 of a series of profiles of the providers of the extensive Distributed Antenna System (DAS) deployment for Super Bowl XLIX at and around the University of Phoenix Stadium in Glendale, Ariz. and other parts of the Phoenix city area as well. Stay tuned all week as we highlight how DAS will keep Super Bowl fans connected, no matter where they roam in and around Phoenix and Glendale this week and weekend.

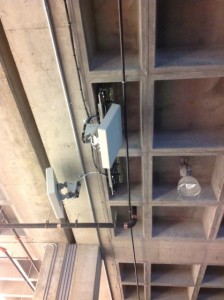
DAS antenna inside the University of Phoenix Stadium. Credit all photos: TE Connectivity

DAS antenna inside the University of Phoenix Stadium. Credit all photos: TE Connectivity

Two years ago, the University of Phoenix Stadium had a pretty good distributed antenna system (DAS) network to handle cellular communications inside the building. But with Super Bowl XLIX coming to the Glendale, Ariz., facility this year, pretty good wouldn’t be good enough — so the stadium’s network operators expanded the DAS by almost 50 percent in preparation for the game-day network surge expected on Feb. 1.

For fans attending the big game with cellular devices in hand that information may be comforting enough; thanks to a bigger, better DAS that is built to service all the major U.S. wireless carriers, they should have no problem getting a signal. Stadium technology professionals, however, usually want to know more about such expansion plans: What does it really mean to increase DAS capacity? How does that new DAS stack up to others in different stadiums and arenas?

More sectors means more capacity

For the Crown Castle neutral-host DAS at the University of Phoenix Stadium, there is one quick measure of how much the DAS expanded: More sectors. In DAS parlance, a “sector” is an area that has a dedicated amount of base station capacity; for the University of Phoenix Stadium DAS, the number of sectors increased from 33 two years ago to 48 sectors now, according to John Spindler, director for product management at DAS gear maker TE Connectivity. TE’s FlexWave Prism and FlexWave Spectrum DAS gear are part of the infrastructure deployed by neutral host Crown Castle in the UoP network.

John Spindler, TE Connectivity

John Spindler, TE Connectivity

Without getting too deep into telecom physics, more sectors in the same amount of space means more capacity. And when it comes to all the different flavors of phones and carrier spectrum, there’s a lot that goes into a DAS to use up that capacity. With all four major U.S. carriers (AT&T, Verizon Wireless, Sprint and T-Mobile) using the DAS, the infrastructure must support a full range of cellular spectrum, from 700 MHz LTE signals to LTE, CDMA, UMTS and EVDO signals in the 800 MHz, 850 MHz, 1900 MHz and 2100 MHz bands. The DAS inside the stadium will use 228 remote antenna units, according to Crown Castle.

“More frequencies, more MIMO [multiple-in, multiple-out antenna-enhancement technology] and heavier sectoring,” is how Spindler described the general needs for most DAS upgrades, and for the UoP DAS, where Spindler foresees another big number for Super Bowl stadium DAS traffic on Feb. 1.

“I would expect to see record [DAS] numbers,” Spindler said.

One DAS to rule them all

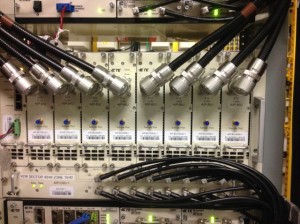
DAS active integration panel

DAS active integration panel

Last year, the DAS situation at MetLife Stadium in New Jersey was especially tough to explain, since both AT&T and Verizon built their own separate infrastructures. According to AT&T its DAS customers at Super Bowl XLVIII used 624 gigabytes of traffic, a record then but a figure that has been surpassed many times this past football season at both college and pro football venues (the recent College Football Playoff championship game, for instance, saw 1.4 TB of DAS traffic for AT&T customers at AT&T Stadium). Verizon claimed last year that its customers used 1.9 TB of wireless data during the Super Bowl, but Verizon never provided specifics whether that number represented just DAS traffic, or Verizon customer usage of the MetLife Wi-Fi network as well.

Either way, the guess is that the DAS at the University of Phoenix Stadium will set new Super Bowl traffic records on Feb. 1, and by all accounts the infrastructure seems ready to handle it. Spindler, for one, said the Crown Castle DAS is “definitely well designed.” And Travis Bugh, senior wireless consultant for CDW (which installed the new Wi-Fi system at UoP), said he was also impressed by the performance of the Crown Castle DAS, which he said seems more than ready for the coming Super Bowl crush.

NEXT: What are the carriers doing to supplement the DAS coverage?

https://duwit.ukdw.ac.id/document/pengadaan/slot777/

https://mtsnupakis.sch.id/wp-content/zeusslot/

https://insankamilsidoarjo.sch.id/wp-content/slot-zeus/

https://smpbhayangkari1sby.sch.id/wp-content/slot-zeus/

https://alhikamsurabaya.sch.id/wp-content/slot-thailand/

https://mtsnupakis.sch.id/wp-content/bonus-new-member/

https://smptagsby.sch.id/wp-content/slot-bet-200/

https://lookahindonesia.com/wp-content/bonus-new-member/

https://ponpesalkhairattanjungselor.sch.id/wp-content/mahjong-slot/

https://mtsnupakis.sch.id/wp-content/slot777/

https://sdlabum.sch.id/wp-content/slot777/

https://sdlabumblitar.sch.id/wp-content/bonus-new-member/

https://sdlabumblitar.sch.id/wp-content/spaceman/

https://paudlabumblitar.sch.id/wp-content/spaceman/