Final Four displays, new Giants scoreboard, all in the new VENUE DISPLAY REPORT!

Mobile Sports Report is pleased to announce the second issue of our new VENUE DISPLAY REPORT, with in-depth profiles of display technology at the Final Four, a huge new video board for the San Francisco Giants at Oracle Park, and the innovative directory displays at the Mall of America. No need to sign up or register — just click on the image below and start reading the issue today!

A new vertical-specific offering of MSR’s existing STADIUM TECH REPORT series, the VENUE DISPLAY REPORT series will focus on telling the stories of successful venue display technology deployments and the business opportunities these deployments enable. Like its sibling Stadium Tech Report series, the Venue Display Report series will offer valuable information about cutting-edge deployments that venue owners and operators can use to inform their own plans for advanced digital-display strategies.

Our reporting and analysis will be similar to that found in our popular STR series, with stadium and venue visits to see the display technology in action, and interviews and analysis with thought leaders to help readers better inform their upcoming technology purchasing decisions. And in case you are new to the MSR world, rest assured that all our VDR reports will be editorially objective, done in the old-school way of real reporting. We do not accept paid content and do not pick profiles based on any sponsorship or advertising arrangements.

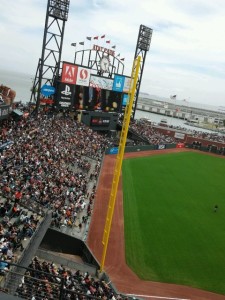
This second issue is packed with real-world information, including how U.S. Bank Stadium uses the Cisco Vision IPTV display management system to help run the 2,000-plus digital displays inside and around the venue. We also take a good look at the huge new video board installed for this season at Oracle Park in San Francisco, and also bring you an in-person profile of the innovative directory display system at the Mall of America.

Start reading the second issue now! No download or registration necessary. You can also go back and view our inaugural VDR issue for more great information!

As venues seek to improve fan engagement and increase sponsor activation, display technology offers powerful new ways to improve the in-stadium fan experience. While these topics are of prime interest to many of our long-term audience of stadium tech professionals, we suggest that you share the link with colleagues on the marketing and advertising sales side of the house, as they will likely find great interest in the ROI enabled by strategic display system deployments.

Sponsorship spots are currently available for future VDR series reports; please contact Paul at kaps at mobilesportsreport.com for media kit information.
Why did Olympics streaming soar, and broadcast TV fail? Podcast episode No. 7 explores why online sports is winning

The drop in prime-time TV viewership for the recent Rio Olympics was a bit of a head-scratcher for many, especially in light of the soaring numbers for online viewership of the same games on various streaming outlets. In the STADIUM TECH REPORT PODCAST episode 7, hosts Phil Harvey and Paul Kapustka explore and explain why this shift from scripted to live happened, and what it means for all types of live sports content going forward. Give it a listen now!

SUBSCRIBE TO THE PODCAST:

Here is the link to the podcast on iTunes!

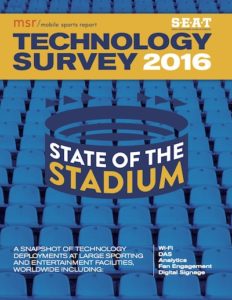
Survey says 75 percent of major sports arenas have Wi-Fi

Sos_thumb_2016MOBILE SPORTS REPORT is pleased to announce the STATE OF THE STADIUM TECHNOLOGY SURVEY 2016, our fourth annual look at technology deployments in major stadiums and arenas. Inside the report we have replies from more than 90 leading sports venues to get a snapshot of technology deployments in several categories, including Wi-Fi, DAS, Analytics, Fan Engagement and Digital Signage. Our survey and analysis shows that:

— Wi-Fi deployments have continued to increase, jumping to 75 percent of all respondents

— DAS deployments have reached 95 percent of all respondent venues

— Ticketing programs still dominate sports CRM usage
Wi-Fi analytics and other digital-information tracking programs are still in their infancy, but more teams are deploying digital-communications strategies.

These results are the only statistical breakdown of what’s being deployed in the stadium technology deployment marketplace so… DOWNLOAD YOUR COPY TODAY!

Mobile Sports Report would like to thank all the representatives from the major professional sports leagues, including the NBA, the NFL, Major League Baseball, the NHL and the MLS, as well as representatives from major colleges and universities and other sporting and entertainment arenas who took time to participate in our fourth-annual survey. It’s their sharing of time and information that makes our survey possible, so thanks!

Mobile Sports Report would also like to thank JMA Wireless for their sponsorship of this year’s survey, which allows us to offer this information free of charge to our readers.

Is WrestleMania the perfect storm for mobile-content consumption? Listen to Podcast No. 4 to find out!

Episode 4 of the STADIUM TECH REPORT PODCAST is live, in which hosts Phil Harvey and Paul Kapustka go to the mats to figure out if WrestleMania and the associated WWE operations are the perfect storm for mobile-content creation. We also discuss why WrestleMania and events like it are capable of creating massive demands for in-stadium bandwidth, like the latest big wireless day at WrestleMania 32 at AT&T Stadium. Listen now and let us know what you think!

SUBSCRIBE TO THE PODCAST:

Here is the link to the podcast on iTunes!

Twitter and the NFL: What does the deal mean for team apps and mobile video? Stadium Tech Report Podcast No. 3 tells you!

Episode 3 of the STADIUM TECH REPORT PODCAST is live, in which hosts Phil Harvey and Paul Kapustka discuss the NFL’s Thursday Night Football streaming deal with Twitter, and what that deal means for both team stadium apps in particular and for mobile video use in general. Take a listen and let us know what you think!

SUBSCRIBE TO THE PODCAST: Here is the link to the podcast on iTunes!

Stadium Tech Report: World Series set new wireless records at AT&T Park

AT&T Park during the World Series. Photo: SF Giants (click on any photo for a larger image)

AT&T Park during the World Series. Photo: SF Giants (click on any photo for a larger image)

The most-connected park in all of baseball is still finding ways to serve more people more data, as proven by the wireless consumption records set by the San Francisco Giants during last year’s World Series.

The traffic generated at the three games at AT&T Park was “definitely more than anything we had ever experienced before,” said Bill Schlough, senior vice president and chief information officer for the Giants. The combined download and upload numbers for both the park’s Wi-Fi network and AT&T traffic on its DAS network averaged 2.08 terabytes per game, Schlough said, with a high of 2.14 TB of total traffic for Game 4.

Since AT&T Park has had Wi-Fi longer than any sports stadium in the U.S. – this season will be its 12th with stadium-wide Wi-Fi – and since last year was the Giants’ third World Series in five years – Schlough’s team was perhaps a bit more prepared than most IT staffs for the expected demands.

“The traffic followed the standard trend, where each round [of the playoffs] saw successively higher demand,” Schlough said. Upload totals also increase as the team progresses through the playoffs, he said, perhaps more so now that fans of all types are getting more adept at adding multimedia to their messaging.

“You don’t just send a text anymore,” Schlough said. “The expectation is that you will send a picture and or a video.”

Replacing Jay Z and Beyonce at the top

Editor’s note: This story is reprinted from our latest Stadium Tech Report, the BASEBALL (and Soccer!) ISSUE, which is available now for free download from our site. The report includes a focus on baseball and soccer stadium technology deployments, and team-by-team coverage of technology deployments for all 30 MLS teams — AND all 20 MLS teams. DOWNLOAD THE REPORT now and read for yourself!

The spoils of victory. Photo: Paul Kapustka, MSR

The spoils of victory. Photo: Paul Kapustka, MSR

Prior to last year’s games with the Kansas City Royals, the top Wi-Fi traffic event at AT&T Park had been a couple concerts earlier in the sum- mer starring Jay Z and Beyonce, where Schlough and his staff saw upload totals of 410 GB on the second night of the show. The World Series games blew by that previous record total with an average of 700 GB uploaded per game, with a high of 750 GB for Game 5.

Wi-Fi download numbers for the three series games averaged 890 GB, Schlough said, with a max of 940 GB during Game 3. For the AT&T customers on the park’s DAS, download num- bers for the Series averaged 320 GB per game with a maximum of 350 GB for Game 4. DAS upload totals were an average of 170 GB per game.

Not even knowing you’re on Wi-Fi

What amazed or satisfied Schlough even more than the raw data numbers was the Wi-Fi take rate, or the number of fans connected to the network. For the Series it hovered right around 50 percent, meaning that every other fan in the 42,000-seat venue was using the network.

The view from left field corner. Photo: Paul Kapustka, MSR

The view from left field corner. Photo: Paul Kapustka, MSR

Regular-season Wi-Fi take rates, he said, were usually in the 30-percent range, climbing to 40 percent as the playoffs progressed. One thing that helps people connect to the Wi-Fi network at AT&T Park is the overall ubiquity of AT&T hotspots – “If you’ve accessed another AT&T hotspot anywhere else, you get automatically activated when you’re here [at AT&T Park],” Schlough said.

Fan surveys, he said, showed that many people didn’t even know they were connected to the Wi-Fi network instead of the cellular networks. “I think that’s cool,” Schlough said. “Fans should come to an event and be universally connected, without having to think about it. They should just be able to turn on their phones and share.”

More APs for the upper deck

For 2015, Schlough and his team will finish off the latest Wi-Fi upgrade with the installation of another 400 under-seat APs for the stadium’s upper decks, which will bring the park’s AP total to almost 1,700 when it’s finished. Already this year Schlough said that fans at Giants games are using more data than last year – an average of 1.1 TB per game over the first 10 games of the 2015 season, compared to an average of 650 GB per game over the same time period in 2014.

Giants fans check out the three WS trophies, at a 2015 season game. Photo: Paul Kapustka, MSR

Giants fans check out the three WS trophies, at a 2015 season game. Photo: Paul Kapustka, MSR

Though he didn’t want to dive into details, since last year Schlough said the network is seeing “a lot more photos and a lot more videos.” He also said his team is on the lookout for use of livestreaming apps like Periscope and Meerkat,
which he expects might happen at AT&T Park before it happens anywhere else, perhaps due to the overall technological bent of the local populace.

“We feel we have a relatively unique fan base,” Schlough said. “If anyone is going to do it [livestream during games] it’ll probably happen first in this region.”

https://duwit.ukdw.ac.id/document/pengadaan/slot777/

https://mtsnupakis.sch.id/wp-content/zeusslot/

https://insankamilsidoarjo.sch.id/wp-content/slot-zeus/

https://smpbhayangkari1sby.sch.id/wp-content/slot-zeus/

https://alhikamsurabaya.sch.id/wp-content/slot-thailand/

https://mtsnupakis.sch.id/wp-content/bonus-new-member/

https://smptagsby.sch.id/wp-content/slot-bet-200/

https://lookahindonesia.com/wp-content/bonus-new-member/

https://ponpesalkhairattanjungselor.sch.id/wp-content/mahjong-slot/

https://mtsnupakis.sch.id/wp-content/slot777/

https://sdlabum.sch.id/wp-content/slot777/

https://sdlabumblitar.sch.id/wp-content/bonus-new-member/

https://sdlabumblitar.sch.id/wp-content/spaceman/

https://paudlabumblitar.sch.id/wp-content/spaceman/