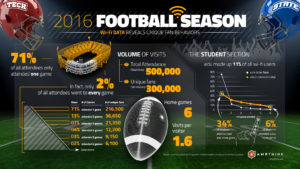
AmpThink infographic about how Wi-Fi data can help teams discover attendance information (click on photo for link to infographic page)
Before digital technology arrived, that question was exceedingly hard to answer, as teams, schools and other ticket-sellers often only knew details of a small percentage of the actual fans in attendance. Paper tickets could be given to family, friends or sold to brokers, meaning the people actually at the game might very well not be the person who purchased the tickets.
While digital ticketing has improved the insight somewhat, many fans at many stadiums still use printed tickets for access, which may still keep the at-game attendee somewhat anonymous. But with a high-definition Wi-Fi network in place, stadium owners and operators can gain deep insights from the fans who do attend, even whether or not they actually log on to the network for access.
Wi-Fi deployment firm AmpThink, which has customers in all the U.S. pro leagues as well as in many major university venues, has put together a deeply sourced infographic showing how Wi-Fi analytics from a full season of games at a Power 5 college football stadium can produce some interesting insights — like the fact that 71 percent of all attendees only went to one game, and that only 2 percent of attendees went to all six games.
Using data to replace assumptions
Editor’s note: This post is part of Mobile Sports Report’s new Voices of the Industry feature, in which industry representatives submit articles, commentary or other information to share with the greater stadium technology marketplace. These are NOT paid advertisements, or infomercials. See our explanation of the feature to understand how it works.
While we here at Mobile Sports Report don’t often recommend company-produced infographics, the data and conclusions surfaced in this one are eye-opening and are likely to be informative to venue owners and operators in a wide range of sports; that’s why we agreed to make this information available to our readers.
We also like the detailed explanations accompanying the infographic, spelling out how the data were collected and how Wi-Fi can be used to identify fans (including those with devices that may not even be purposely connected to the network). The last part of the infographic page, which asks “How could Wi-Fi data change sports marketing?” is a question we’ve already seen others starting to answer — and one we expect many to test in the near future as teams deploy not just Wi-Fi networks but also Bluetooth beacons, login portal pages and other methods to increase the granularity of fan identification.
For the unidentified client, AmpThink said the results “surprised” the school, which had (like others) believed in “long-held industry assumptions about fan loyalty and audience size.” It’s our guess that digital data will increasingly be used to replace assumptions, and we’re looking forward to sharing your stories of how that happens.
