Wi-Fi stats left on the bench in RootMetrics’ baseball stadium network performance scores

The folks at RootMetrics have another network research project out, one that claims to determine the best wireless connectivity in all the U.S. Major League Baseball stadiums. However, the report doesn’t include Wi-Fi network performance in any of its scoring processes, and it doesn’t publicly reveal the limits of its network tests, which are based on just one day’s results from a handful of devices in each venue and do not include any results from Apple iOS devices.

According to the RootMetrics survey, Fenway Park in Boston ended up atop their results, with strong scores for all the four major U.S. wireless carriers, a list that includes AT&T, Verizon Wireless, Sprint and T-Mobile. But the caveat about those “scores” is that they are composite results devised by RootMetrics itself and not a direct reflection of numerical network performance.

At Fenway, for instance, RootMetrics’ own results show that T-Mobile’s median upload and download speeds are 3.0 Mbps and 3.5 Mbps, respectively, while Verizon’s are 20.7 Mbps and 13.0 Mbps. Yet RootMetrics gives T-Mobile a third place at Fenway with a 89.5 “Rootscore,” compared to Verizon’s winning mark of 97.9, meaning that in RootMetrics’ scoring system a network six times as fast is only 10 percent better.

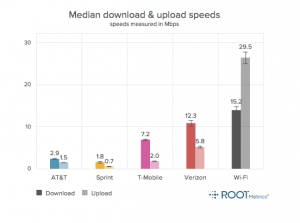
While it’s not included in the scoring or ranking, the Wi-Fi network at Fenway as measured by RootMetrics delivered speeds of 23.1 Mbps down and 22.0 up, besting all the cellular networks in the stadium. In its blog post RootMetrics does not explain why it doesn’t include Wi-Fi networks in its network measurements or scoring, even though its testing does show Wi-Fi performance at individual stadiums. Over the past year, Major League Baseball led a $300 million effort to install Wi-Fi networks in all MLB parks.

Unlike its metro-area tests, where RootMetrics uses “millions of data points,” the baseball stadium tests were calculated using just one device from each carrier — and all are Android-based, since RootMetrics’ internal testing system doesn’t run on iOS devices. And while RootMetrics said that for its results each park was visited “at least once,” in going through all 29 stadium reports there was only a single visit date mentioned for each one. RootMetrics also did not visit Rogers Centre in Toronto, home of the American League’s Blue Jays.
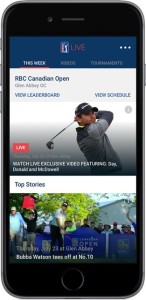
PGA Tour’s live-action online service for Thursday-Friday rounds debuts this week at $4.99 per month

Screen shot of PGA TOUR LIVE service on iPhone. Photo: PGA Tour

Screen shot of PGA TOUR LIVE service on iPhone. Photo: PGA Tour

The PGA’s over-the-top live action service for Thursday and Friday rounds debuts this week during the Quicken Loans National event, with a seven-day free trial before the $4.99 per month charge applies.

Announced earlier this year, the service produced by Major League Baseball’s Advanced Media (MLBAM) operations will be initially available for any desktop devices at PGATOURLIVE.com, but only for Apple iPhones and iPads on the mobile front. According to the PGA Tour the service will be available through Android and other platforms “at a later date.”

Here’s the official skinny on who you’ll be able to watch live (yes of course tournament “host” Tiger Woods will be part of the coverage) as part of the service’s “marquee group” format, which basically follows selected groups of players over their entire round. For those who can’t get enough golf it will be an interesting “second screen” to the Golf Channel cable coverage of Thursday and Friday rounds.

PGA TOUR LIVE debuts Thursday at 7:30 a.m. ET and will provide exclusive shot-by-shot coverage of the following groups on Thursday: 8:10 a.m., THE PLAYERS champion Rickie Fowler paired with Ben Crane and James Hahn; 8:21 a.m., former Quicken Loans National champion and The Presidents Cup 2015 International Team vice-captain K.J. Choi from host country South Korea with International Team hopefuls Danny Lee of New Zealand and John Senden of Australia.

Friday’s 8:10 a.m. feature group includes three former Quicken Loans National champions: tournament host Tiger Woods, Bill Haas and Nick Watney. At 8:21 a.m., defending Quicken Loans National champion Justin Rose tees off with Jimmy Walker, No. 3 in the FedExCup points standings with two wins this season, and David Lingmerth of Sweden, who won his first PGA TOUR title last month at the Memorial Tournament presented by Nationwide Insurance.

Following the conclusion of the featured groups on Thursday and Friday, PGA TOUR LIVE will shift its live broadcast coverage to the Featured Holes at the Robert Trent Jones Golf Club – a pair of par-3s, the 11th and 16th. Overall, PGA TOUR LIVE will deliver access to more than 11 hours of live coverage to fans each day.

For the remainder of the season, PGA TOUR LIVE will be available during the following tournaments: next week’s World Golf Championships-Bridgestone Invitational (Aug. 6-7), the Wyndham Championship (Aug. 20-21), and then the FedExCup Playoff events: The Barclays (Aug. 27-28), Deutsche Bank Championship (Sept. 4-5, which actually is Friday-Saturday with a Monday finish), BMW Championship (Sept. 17-18) and the TOUR Championship by Coca-Cola (Sept. 24-25). According to the PGA, the $4.99 charge is good for 30 days whenever it is purchased, so time your buy accordingly.

Report excerpt: MLB’s Wi-Fi everywhere plan nears completion

By the end of the season, Major League Baseball’s $300 million plan to bring Wi-Fi and DAS to every ballpark should be mostly complete, cementing the league’s title as the best-connected sport for now, and most likely for the near-term future as well.

While other sports, leagues and conferences rely on individual teams, schools and stadiums to figure out their own budgetary paths to connectivity, MLB’s unique decision to foot a major portion of the networking build-out bill should reap dividends for fans, clubs, and all the parties involved in the business of in-stadium wireless, said Joe Inzerillo, the executive vice president and chief technology officer for Major League Baseball Advanced Media (MLBAM).

“In general, things are going pretty well [with the build-outs],” said Inzerillo in a recent interview. “By the end of the calendar year, all the major construction will be complete.”

Vague on specifics, but clear on the goal

Editor’s note: This story is reprinted from our latest Stadium Tech Report, the BASEBALL (and Soccer!) ISSUE, which is available now for free download from our site. The report includes a focus on baseball and soccer stadium technology deployments, and team-by-team coverage of technology deployments for all 30 MLS teams — AND all 20 MLS teams. DOWNLOAD THE REPORT now and read for yourself!

Joe Inzerillo, Executive Vice President and Chief Technology Officer for Major League Baseball Advanced Media (MLBAM)

Joe Inzerillo, Executive Vice President and Chief Technology Officer for Major League Baseball Advanced Media (MLBAM)

In somewhat curious fashion, Inzerillo and MLBAM pointedly do not provide specifics on the buildouts, which include both new Wi-Fi networks for parks that didn’t have deployments, and many upgrades for those that did. While Inzerillo did provide a short list of some of the new MLBAM-led deployments, including those for the Kansas City Royals, the Colorado Rockies, the Texas Rangers, the Houston Astros, the Arizona Diamondbacks, the Chicago White Sox and the Minnesota Twins, to find out others we had to call or contact teams directly.

New networks coming in at St. Louis’ Busch Stadium and Milwaukee’s Miller Park are also MLBAM-led projects, according to sources with each team. So even though there is no master list of deployments, MSR research shows that by the end of the 2015 season all but two of the league’s 30 stadiums should have working, updated Wi-Fi and DAS deployments, with MLB primarily responsible for putting networks into eight of the 10 venues that didn’t have Wi-Fi as of last season.

The two-year-plus plan also includes construction of multiple new or retooled distributed antenna systems (DAS) that ensure participation by all four of the major U.S. wireless carriers, since all four also contributed to the overall buildout budget.

When asked for specifics on the amount that each entity – MLB, the carriers or the teams – contributed to the buildout pool, Inzerillo declined to give exact figures, other than the $300 million total.

“The notion is, everybody has an interest in making sure the people attending the game are happy with their [wireless] experience,” said Inzerillo, describing the thinking behind the deal that brought together the league, the carriers and the teams. While some industry sources seem to believe that carriers and MLBAM footed most of the deployment costs, Inzerillo said all entities involved paid some share of the total bill.

“It’s fair to say everybody has some skin in the game,” Inzerillo said.

For MLBAM, the reason behind seeking a solid level of connectivity at all parks is clear, due to “Ballpark,” its league-wide single app for in-stadium use. Though its features differ slightly from park to park depending on technology deployments (such as beacons) and desired uses, MLB’s plans to monetize its own apps depend on their being reliable connectivity on hand – so instead of waiting for teams to get there on their own, MLBAM led the charge, a move Inzerillo said made sense for several reasons, including the ability to herd carriers together and to share rare expertise.

Herding the cats known as carriers

If there’s a topic that scares stadium tech pros the most, it’s having to deal with all the major wireless carriers in negotiating DAS deployments. One of the top reasons some stadiums end up choosing a neutral host for their DAS is so that the neutral host provider can act as a buffer for the catfights that can occur between different carriers’ desires and needs. In MLB’s case, Inzerillo said MLBAM was that lukewarm water between the fire and ice.

Railing Wi-Fi AP enclosure at Seatte's Safeco Field. Photo: MLBAM

Railing Wi-Fi AP enclosure at Seatte’s Safeco Field. Photo: MLBAM

“We [MLBAM] are uniquely positioned to bring all the carriers together, and to give them a ‘safe zone’ to talk about potential issues,” Inzerillo said. Through its short history of supporting original team apps and then its own apps, Inzerillo said that MLBAM also gained a significant amount of internal telecom expertise, a resource not available to most teams.

Having dedicated app or telecom expertise in the form of a full-time employee is something that is hard to do locally, Inzerillo said. “It’s hard to find people with these skills,” he noted, especially for the smaller IT staffs found inside sports teams. The same thing goes for overall deployment expertise, Inzerillo said. “These deployments are big, capital-intensive projects, and they require specialized assets from a human standpoint,” Inzerillo said. “It’d be impossible to have resources [like MLBAM has] on a local staff.”

Construction is half the cost

That said, Inzerillo is quick to add that without the teams’ help and internal expertise, the entire project probably wouldn’t have gotten off the ground.

“We really couldn’t do this without the teams – there’s just a huge effort at each of the facilities,” Inzerillo said. The recognition of the local hard work, he said, is the main reason why MLBAM isn’t putting out a “master list” of its stadium upgrades – “It’s really a team story, and it’s something for them to tell their local markets,” Inzerillo said.

And for all the focus on the latest Wi-Fi antennas and fine-tuned DAS gear, Inzerillo also noted that it’s the other end of deployment – the physical work of putting networks in – that is the hardest part of the puzzle to solve.

“Things that can make or break a deployment are low tech,” Inzerillo said, claiming that half of the cost of any deployment is usually the labor to put it in. “Power, conduits and just knowing how to perform [construction] inside a ballpark cannot be understated,” Inzerillo said.

That’s especially true when you are putting a network in a venue like Boston’s Fenway Park, which is not just old but also has historic construction parameters that need to be worked around. Even Coors Field in Denver, which is a baby compared to Fenway, was still “old” when compared to the era of cellphones, Inzerillo noted.

“When it was built 20 years ago, there were no smartphones and barely an Internet,” said Inzerillo of Coors Field. So things like conduit easements, he said, weren’t anticipated, and added to construction costs.

“Twenty years doesn’t seem old, but compared to technology changes, it is,” he said.

And even though Inzerillo is eager to get to the end of the first long phase of deployments – he talked of “clearing the trees and getting ready to plant crops and tend the garden” – he also knows it’s a job that’s never quite over.

“It’s sort of like painting the Golden Gate bridge, where as soon as you’re done you need to start again,” Inzerillo said. “We’ve got beacons in 29 parks that we’re just starting to use, and now you have to think about things like wearables and the Apple Watch. There’s always new stuff, which is why infrastructure is so important. We’re always going to be thinking, do I have enough stuff in the walls?”

Stadium Tech Report: San Francisco’s AT&T Park lives up to its wireless reputation

Another tough day at the office for MSR. Credit all photos: Paul Kapustka, MSR. (Click on any picture for a larger image)

Another tough day at the office for MSR. Credit all photos: Paul Kapustka, MSR. (Click on any picture for a larger image)

Many times here at Mobile Sports Report we’ve referred to AT&T Park as the “most connected” or “best connected” stadium in baseball, if not for all sports anywhere. But even after multiple network tours and numerous reports from stats given to us by Giants CIO Bill Schlough and his staff I realized that one thing I’ve never done is to roam around the park on a game day, checking to see if its renowned Wi-Fi and DAS networks perform as promised.

Now after attending a recent day game as the guest of AT&T, I can tell you that the stadium that first put in fan-facing Wi-Fi for every seat is still at the forefront of ballpark connectivity, with Wi-Fi and DAS performance that knocks the ball out of the park almost every time. I say “almost” because during my walkaround tour I was able to find one place in the park that had almost no connectivity at all — but I will also bet you that as soon as this story is published, Schlough and his team will likely be out there the next day installing some kind of coverage since he and they have an almost unmatched enthusiasm for making their fan-facing network the best it can be. That, plus a strong partnership with AT&T, gives fans at Giants games perhaps the best stadium network anywhere, with performance so good for so long that it has almost become somewhat of an afterthought, one of the best kind of compliments a network staff can receive.

Nothing beats a strong team

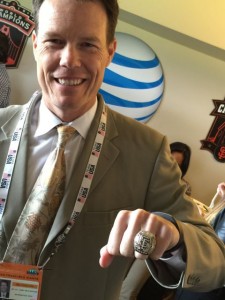
Dynasty is a word fans like to use around Third and King Street in San Francisco, especially after the Giants won their third World Series title in 5 years last fall. Schlough, who loves baseball and the Giants as much as he loves networks, used the press-day gathering to show off his most recent Series ring, a chunk of gold and diamonds that probably gives you a wrist-curl workout when you put it on.

AT&T Park CIO Bill Schlough shows off his World Series bling.

AT&T Park CIO Bill Schlough shows off his World Series bling.

(Point of reference: Schlough offered the ring to me to try on, but as a dyed-blue Cubs fan I refused. “Waiting for one with ‘Cubs’ on it,” I told him. As we say in Chicago, “if it takes forever.”)

You might have heard some of the early Wi-Fi stories from AT&T Park before, but they’re fun to repeat. Then known as SBC Park, after the sponsoring “Baby Bell” that would later revive the family name of AT&T, the Wi-Fi network that debuted in 2004 attracted an average of about 94 fans a game, Schlough said, diehard geeks who would have to put up with people mocking them for bringing laptops to a ballgame. Remember, the iPhone was still 3 years away from existing, and you had to stick a PC card in a laptop to connect to Wi-Fi.

Fast forward to 2015, and now for regular season games the Giants see an average of just more than 13,000 people connecting to the Wi-Fi network, a number that has basically leveled off over the past 3 years, Schlough said. What hasn’t leveled off, however, is data use — even from last season, when fans used an average of 591 gigabytes of data per game, so far this season they’re averaging 915 GB per game. That’s why this season Schlough and team will be busy adding another 400+ Cisco Wi-Fi access points to the park, a total that should hit 1,700 by the time October rolls around.

“We’ll be working hand in hand with AT&T trying to stay one step ahead of demand,” Schlough said.

AT&T Park cabling runs are SRO

AT&T Park cabling runs are SRO

Scott Mair, AT&T’s senior vice president of technology, was on hand to help lead network tours before the game and to talk about how AT&T was using a new device called the EchoBOT to help gauge network performance in the park. Though it’s a bit of inside baseball, EchoBOT — which is basically an off-the-shelf cell phone that sits in a ruggedized box — is the kind of thing that can come out of the smart-person pool at a technology giant like AT&T. Invented in-house, the EchoBOT basically gives network operators an on-the-spot way to determine not just how the network is working, but what the actual user experience is like from the end-user point of view.

With 18 EchBOTs scattered throughout AT&T Park, Schlough and AT&T can get a much more granular view of how the stadium’s network is performing, just another way of using the resources of one of the world’s biggest telecom companies helps the fan experience at AT&T Park.

The one place without Wi-Fi

With our network tours concluded and some crispy chicken fingers inhaled in the comfy confines of the AT&T suite just above the third-base line, it was time to go to work to see if the AT&T Park network could deliver as promised. Since I’ve sat in seats at the park many times and had great connectivity there, I spent my time during the afternoon game seeking out what I thought might be some of the hardest places to bring connectivity. The first, in the second-level concourse, looked like it might be a tough antenna spot, with narrow halls and lots of concrete. But bam, on my Verizon iPhone 6 Plus I got a Wi-Fi signal of 31 Mbps down, 21 Mbps up; on my companion loaner device from AT&T, an LG Optimus G Pro, I got a 4G LTE connection of 26.15 Mbps down, 18.02 up. (For all remaining measurements I’ll just use the down/up convention to save time; I was using the standard Speedtest.net app from Ookla for all measurements.)

So yeah, you can connect while you’re in line to get a hot dog.

Here's the only place we couldn't find decent Wi-Fi. #firstworldproblem

Here’s the only place we couldn’t find decent Wi-Fi. #firstworldproblem

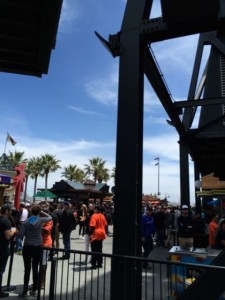
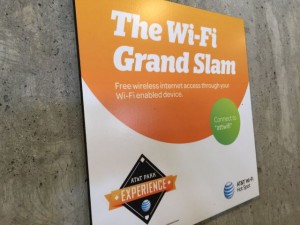
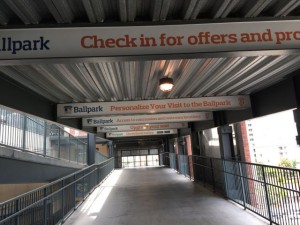
Strolling through the concourse toward right field, I saw several Wi-Fi advertisement signs, letting fans know they should definitely connect to the network. That’s a sign of deployment confidence, unlike many parks that install Wi-Fi but don’t really promote it, perhaps in order to keep user numbers down. After walking outside to get a view of McCovey Cove and the kayaks waiting for home-run balls to clear the park’s fences for a “splash landing,” I found a spot with almost zero connectivity — in the standing-room-only area backed up against the wall overlooking the bay.

With a Wi-Fi reading of 0.93/2.23 on the Verizon device and a 0.94/3.24 on Verizon 4G the SRO perch on the promenade was easily the poorest connection I found all day. But looking around, it’s kind of a silly place to be looking at your phone since from one direction a well-hit ball might be landing on your head and in the other direction there’s great views of the San Franicsco Bay. But still it does go to show that even in the most-connected stadium perhaps on earth, it’s not easy to get a signal everywhere. With no roof overhead and no railings close by, there simply isn’t a place to put an antenna out there. (But I bet Schlough and team will soon come up with a solution.)

Concourses covered, and upper deck too

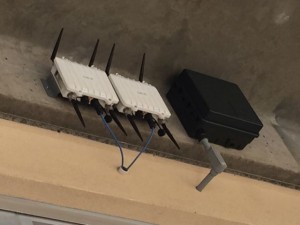
I kept wandering around the outfield concourse and found decent connectivity at the centerfield Coors Light bar, 9.32/17.31 for Wi-Fi on the Verizon device and 14.21/43.00 for Wi-Fi on the AT&T device, as well as outside the Giants’ social media cafe in left-center, 14.32/32.20 for Wi-Fi on the Verizon device and 13.61/34.70 for Wi-Fi on the AT&T phone. Unless you’re a Wi-Fi geek like me you probably won’t ever see the APs since they are painted to match the structures they’re attached to. But I could see multiple APs hanging off the centerfield scoreboard structure, a piece of architecture that helps to deliver such solid connectivity to the open outside areas.

You can see Wi-FI APs -- if you know where to look.

You can see Wi-FI APs — if you know where to look.

Taking a break in a standing area behind the left field foul pole I got a smoking result for Wi-Fi on the Verizon phone, 22.46 Mbps on the download side and an amazing 52.05 on the upload. (I think it’s important to note that some of the best signals were on a device from an AT&T competitor, a sign that the facility does a great job of ensuring that any customer will get a good signal, no matter where you purchased your phone or service plan.) Climbing the stairwells to the view deck I still got a good signal on the concourse behind the seats in upper left field — 7.24/8.75 on the Verizon phone.

Since it was getting windy and cold (summer in SF!) I ducked back inside and found an empty seat in section 332, near the upper left field corner of the park. There I got a Verizon Wi-Fi mark of 17.52/24.33, and a Verizon 4G LTE mark of 5.62/6.81, again showing that the AT&T Park DAS is also delivering solid performance for customers on other carriers. The AT&T phone at that location saw 12.46/18.79 on Wi-Fi and 12.68/17.06 on 4G LTE. According to Schlough, the AT&T neutral-host DAS, which uses CommScope ION equipment, is so good that many fans don’t even bother to switch their phones to Wi-Fi. The upper deck, or view level, is scheduled to get many of the APs slated for installation this summer, in the under-the-seat enclosures that bring the network right into the seating areas.

Conclusion: Like the Giants, AT&T Park is tough to beat

Here at MSR we get the question a lot — “what’s the park with the best network?” — and I would have to say that like its tenants, AT&T Park is tough to beat. Schlough and the impressive IT team down at AT&T Stadium have a friendly rivalry, and you can’t have the most-connected discussion without mentioning Levi’s Stadium. But the park that did Wi-Fi first continues to improve year in and year out, never resting on its historic laurels. That’s a “dynasty” that is perhaps as impressive as the one built by the team on the field.

(More AT&T Park visit pictures below)

A little hard to see, but if you look closely you can see the Giants showing fan social media posts on the big screen.

A little hard to see, but if you look closely you can see the Giants showing fan social media posts on the big screen.

These signs are up all over the park

These signs are up all over the park

EchoBOT enclosures (white) next to a Wi-FI AP

EchoBOT enclosures (white) next to a Wi-FI AP

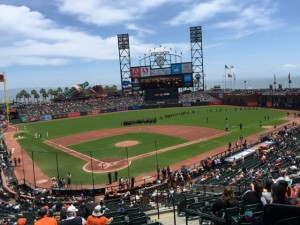
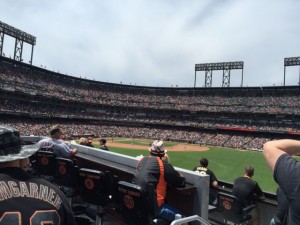
View from the Coors Light concourse walk-up bar in center field

View from the Coors Light concourse walk-up bar in center field

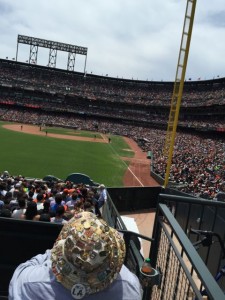
Good connectivity here in left field. Maybe the buttons on the hat improved reception?

Good connectivity here in left field. Maybe the buttons on the hat improved reception?

MLB app ads greet you as you walk up the stairs at AT&T Park

MLB app ads greet you as you walk up the stairs at AT&T Park

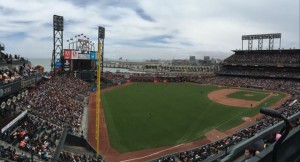
Nice place for a ballpark, don't you think?

Nice place for a ballpark, don’t you think?

For Giants fans only: I swear that thing weighs about 3 pounds

For Giants fans only: I swear that thing weighs about 3 pounds

MSR editor Paul Kapustka, your man on the Wi-Fi scene.

MSR editor Paul Kapustka, your man on the Wi-Fi scene.

Stadium Tech Professionals: Time to take our 2015 stadium tech survey!

SOS14_thumbIf you are a stadium technology professional working for a school, team or stadium ownership group, it’s that time of year again — we need your participation to make our 2015 State of the Stadium Technology Survey our best yet! Now in its third year of existence, the “State of the Stadium” survey is the only independent, large-public-venue research that charts deployments of stadium technology like Wi-Fi, DAS, Digital Signage and Beaconing, and the use of digital sports marketing tools like CRM and social media. If you are part of a stadium operations group and know the answers, take the 2015 survey right now!

Before I get to a deeper explanation of the survey, a quick story: During last year’s survey season, I called a team IT exec that I knew well and asked why nobody from his organization had taken the survey. “Well, we don’t have Wi-Fi installed yet,” the exec said. “We’ll take the survey next year after it’s deployed.” I didn’t have the heart to say it at the time but — his take was completely the WRONG ANSWER. Why? Because this is an ANONYMOUS, AGGREGATED INFORMATION ONLY survey, which means that answers aren’t tied to any school, team or individual. Just look at last year’s survey to see how the answers are reported. That also means that all answers are completely confidential, and will not be sold, marketed or otherwise communicated in any way, shape or form outside of the ANONYMOUS TOTALS used in the survey report.

So since we’re trying to find out aggregate numbers — not individual details — it’s just as important for all of us to know who doesn’t have Wi-Fi as well as who does. So even if your school or team or stadium doesn’t have Wi-Fi — and may never have Wi-Fi — you should still TAKE THE SURVEY and add your organization’s information to the total. The more answers we get, the better the data are for everyone.

Survey time is time well spent

And that “everyone” thing leads me to my next point: If you’re a regular reader here you can and should consider the few minutes it takes to complete the survey as a small way of “paying back” to the rest of the members of this fine industry, many of whom make time for the interviews, visits and emails that form the core of all the excellent free content available here on the MSR site and through our long-form reports. We know you are busy, and that spending time answering a list of technology questions may not seem like the highest priority on your to-do list. But a little bit of your time can really help us all.

That’s because we also know, from our website statistics and from our report download numbers and just from conversations with many of you, that our audience of stadium technology professionals appreciates the honest, objective stories and analysis we provide. (We humbly thank you for making us a regular reading choice.) And now, by taking the survey, you can help make the site and our work even better, just by adding your team, school or stadium’s technology deployment information into the 2015 State of the Stadium Technology Survey. The more results we get, the better and more informative the survey becomes — and that’s something that’s truly a win-win situation for all involved.

Once again the State of the Stadium Technology Survey will be exclusively delivered first to the attendees of the SEAT Conference, being held this year in our home town of San Francisco, July 19-22. Production of this year’s survey is made possible by the sponsorship of Mobilitie, and through our partnership with the SEAT Consortium, owners and operators of the excellent SEAT event. All those who participate in the survey will receive a full digital copy of the final report, whether you attend the SEAT Conference or not.

Final reminder: This survey is meant to be taken ONLY by stadium technology professionals, executives, and team or school representatives who can accurately describe the deployments in place at their organization. It is NOT a survey to be taken by everyone, only by those who have a deployment to describe. If you have any questions about whether you should take the survey or not, send an email to me at kaps at mobilesportsreport.com. Thanks in advance for your time and participation!

RootMetrics debuts tests of cell service inside stadiums

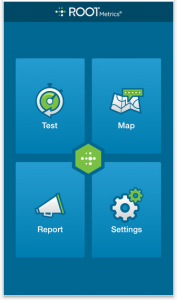
Screen shot of RootMetrics reporting app.

Screen shot of RootMetrics reporting app.

RootMetrics, a Bellevue, Wash.-based concern that has made a name for itself by conducting tests of wireless services in cities and airports across the nation, is now starting to test wireless networks in sports stadiums, which may give fans a heads-up on how their provider is performing inside stadium walls.

Though it only has visited a handful of arenas so far, RootMetrics eventually plans to test more than 100 stadiums this year, according to the company. For each venue, RootMetrics sends an unspecified number of testers to track data performance of the top four wireless carriers in the U.S., a list that includes AT&T, Verizon Wireless, Sprint and T-Mobile. RootMetrics’ venue testers also check performance of the internal Wi-Fi network if one is available, but it does not let Wi-Fi compete for its “RootScore Award,” which it bestows upon the carrier with best performance in the combined categories of speed and “data reliability,” basically a measurement of the ability to make and hold a connection during any wireless data request or action.

RootMetrics also doesn’t take into account whether or not any of the carriers has preferential deals inside a venue, which may give that provider a leg up on the competition. For its report on the Staples Center, for instance, RootMetrics gives its award to Verizon, which is not surprising to us since Verizon built both the Wi-Fi and the DAS network at the facility. But RootMetrics makes no mention of the business agreements at Staples or anywhere else, which is by design, according to the company.

Why can’t Wi-Fi win?

RootMetrics CEO Bill Moore said in a recent phone interview that such details about contracts and preferred suppliers really don’t matter to consumers — what really matters, he said, is how well each carrier performs in the venue.

While the “scoreboard” mentality does perform a service by presenting just what data the testers find, the RootMetrics venue surveys have some gaps that may need to be filled or changed in the future to present a fully accurate picture of stadium network performance. One big reporting gap is the fact that RootMetrics doesn’t use any iOS devices in its stadium tests, a strange omission since most stadium networks say they still see a majority of iPhones among the devices being used on stadium networks. RootMetrics also seems to unfairly leave Wi-Fi networks out of the scoring, even though in many cases so far the local Wi-Fi networks far outperform the carrier cellular links.

Screen shot of RootMetrics' test results for the Moda Center in Portland.

Screen shot of RootMetrics’ test results for the Moda Center in Portland.

For Portland’s Moda Center, for instance, RootMetrics gives its RootScore award to Verizon, since in their testing Verizon was found to have better data reliability and better data speeds than the other cellular carriers. But the stadium’s in-house Wi-Fi network was 3 Mbps faster than Verizon on the download side and more than five times faster than Verizon on the upload side — yet Wi-Fi wasn’t mentioned in the venue “scores” and only got a footnote at the bottom of the results page.

Founded in 2008, RootMetrics has (apparently) built a good business in its chosen field, since it was acquired last month by the Englewood, Colo.-based IHS, a large information and analytics concern that recorded $546 million in revenue for its most recent quarter.

In the industry, RootMetrics is well known for its wireless coverage performance map and its “RootScores,” which attempt to determine winners and losers in the wireless service game for major U.S. metropolitan areas and the nation’s busiest airports. The basic RootMetrics premise is that they measure exactly what service levels consumers see in real life, providing an independent way for customers to evaluate services in a given area. While consumers can see the high-level results of its tests — which include both internal testing as well as data “crowdsourced” from consumers who download the RootMetrics reporting app — RootMetrics also sells its information directly to carriers and other infrastructure providers.

https://duwit.ukdw.ac.id/document/pengadaan/slot777/

https://mtsnupakis.sch.id/wp-content/zeusslot/

https://insankamilsidoarjo.sch.id/wp-content/slot-zeus/

https://smpbhayangkari1sby.sch.id/wp-content/slot-zeus/

https://alhikamsurabaya.sch.id/wp-content/slot-thailand/

https://mtsnupakis.sch.id/wp-content/bonus-new-member/

https://smptagsby.sch.id/wp-content/slot-bet-200/

https://lookahindonesia.com/wp-content/bonus-new-member/

https://ponpesalkhairattanjungselor.sch.id/wp-content/mahjong-slot/

https://mtsnupakis.sch.id/wp-content/slot777/

https://sdlabum.sch.id/wp-content/slot777/

https://sdlabumblitar.sch.id/wp-content/bonus-new-member/

https://sdlabumblitar.sch.id/wp-content/spaceman/

https://paudlabumblitar.sch.id/wp-content/spaceman/