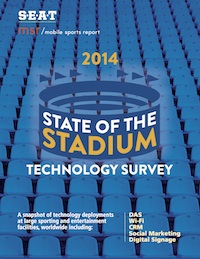
 If you are a stadium technology professional working for a school, team or stadium ownership group, it’s that time of year again — we need your participation to make our 2015 State of the Stadium Technology Survey our best yet! Now in its third year of existence, the “State of the Stadium” survey is the only independent, large-public-venue research that charts deployments of stadium technology like Wi-Fi, DAS, Digital Signage and Beaconing, and the use of digital sports marketing tools like CRM and social media. If you are part of a stadium operations group and know the answers, take the 2015 survey right now!
Before I get to a deeper explanation of the survey, a quick story: During last year’s survey season, I called a team IT exec that I knew well and asked why nobody from his organization had taken the survey. “Well, we don’t have Wi-Fi installed yet,” the exec said. “We’ll take the survey next year after it’s deployed.” I didn’t have the heart to say it at the time but — his take was completely the WRONG ANSWER. Why? Because this is an ANONYMOUS, AGGREGATED INFORMATION ONLY survey, which means that answers aren’t tied to any school, team or individual. Just look at last year’s survey to see how the answers are reported. That also means that all answers are completely confidential, and will not be sold, marketed or otherwise communicated in any way, shape or form outside of the ANONYMOUS TOTALS used in the survey report.
So since we’re trying to find out aggregate numbers — not individual details — it’s just as important for all of us to know who doesn’t have Wi-Fi as well as who does. So even if your school or team or stadium doesn’t have Wi-Fi — and may never have Wi-Fi — you should still TAKE THE SURVEY and add your organization’s information to the total. The more answers we get, the better the data are for everyone.
Survey time is time well spent
And that “everyone” thing leads me to my next point: If you’re a regular reader here you can and should consider the few minutes it takes to complete the survey as a small way of “paying back” to the rest of the members of this fine industry, many of whom make time for the interviews, visits and emails that form the core of all the excellent free content available here on the MSR site and through our long-form reports. We know you are busy, and that spending time answering a list of technology questions may not seem like the highest priority on your to-do list. But a little bit of your time can really help us all.
That’s because we also know, from our website statistics and from our report download numbers and just from conversations with many of you, that our audience of stadium technology professionals appreciates the honest, objective stories and analysis we provide. (We humbly thank you for making us a regular reading choice.) And now, by taking the survey, you can help make the site and our work even better, just by adding your team, school or stadium’s technology deployment information into the 2015 State of the Stadium Technology Survey. The more results we get, the better and more informative the survey becomes — and that’s something that’s truly a win-win situation for all involved.
Once again the State of the Stadium Technology Survey will be exclusively delivered first to the attendees of the SEAT Conference, being held this year in our home town of San Francisco, July 19-22. Production of this year’s survey is made possible by the sponsorship of Mobilitie, and through our partnership with the SEAT Consortium, owners and operators of the excellent SEAT event. All those who participate in the survey will receive a full digital copy of the final report, whether you attend the SEAT Conference or not.
Final reminder: This survey is meant to be taken ONLY by stadium technology professionals, executives, and team or school representatives who can accurately describe the deployments in place at their organization. It is NOT a survey to be taken by everyone, only by those who have a deployment to describe. If you have any questions about whether you should take the survey or not, send an email to me at kaps at mobilesportsreport.com. Thanks in advance for your time and participation!


