Average per-fan Wi-Fi use total jumps again at Super Bowl 52

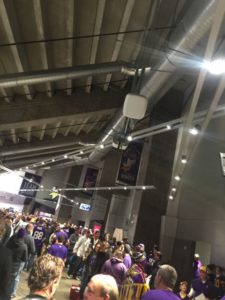
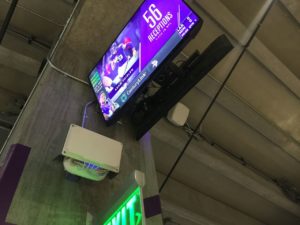
Seen in the main concourse at U.S. Bank Stadium: Two IPTV screens, one Wi-Fi AP and a DAS antenna. Credit: Paul Kapustka, MSR

After a year where the actual amount of average Wi-Fi data used per connected fan at the Super Bowl dropped, the trend of more data used per fan reversed itself again to a new peak at Super Bowl 52, with an average total of 407.4 megabytes per user.

Even though the number of unique connections to the Wi-Fi network at U.S. Bank Stadium for Super Bowl 52 also increased to a record 40,033 users (according to the official statistics compiled by Extreme Networks), the jump from 11.8 terabytes of Wi-Fi data used at Super Bowl 51 to 16.31 TB used at Super Bowl 52 pushed the average per-user number to the top, surpassing the 333 MB per user number from Super Bowl 51, as well as the 370 MB per user mark seen at Super Bowl 50.

While this statistic has not ever been called out by the Extreme Networks Super Bowl compilations, we here at MSR think it is a vital mark since it shows that even with more users on the network those connected users are still using more data. That means that IT departments at venues everywhere should probably still plan for no letup in the overall continued growth in demand for bandwidth at large-venue events, especially at “bucket list” events like the Super Bowl.

Last year we guessed the drop in per-user totals from Super Bowl 50 to Super Bowl 51 might have been due to a larger number of autoconnected users, but we never got an answer from the Extreme Networks team when we asked that question. At U.S. Bank Stadium there was also an autoconnect feature to the Wi-Fi for Verizon Wireless customers, but it didn’t seem to affect the per-user total mark.
Fans use 16.31 TB of Wi-Fi data during Super Bowl 52 at U.S. Bank Stadium

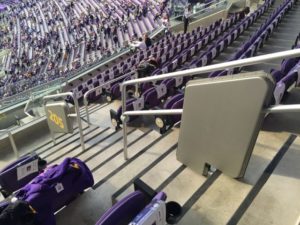
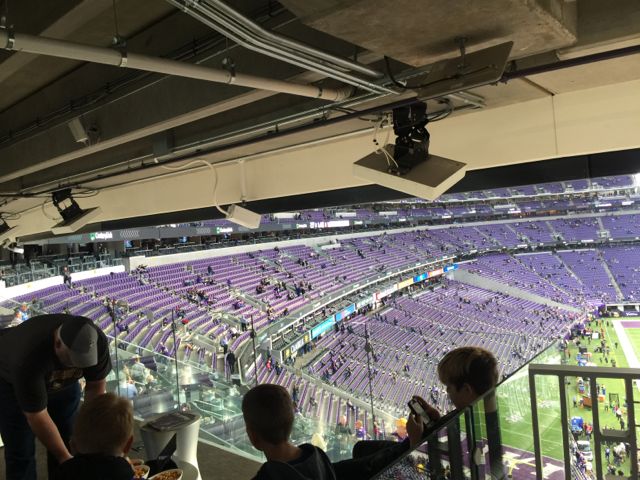
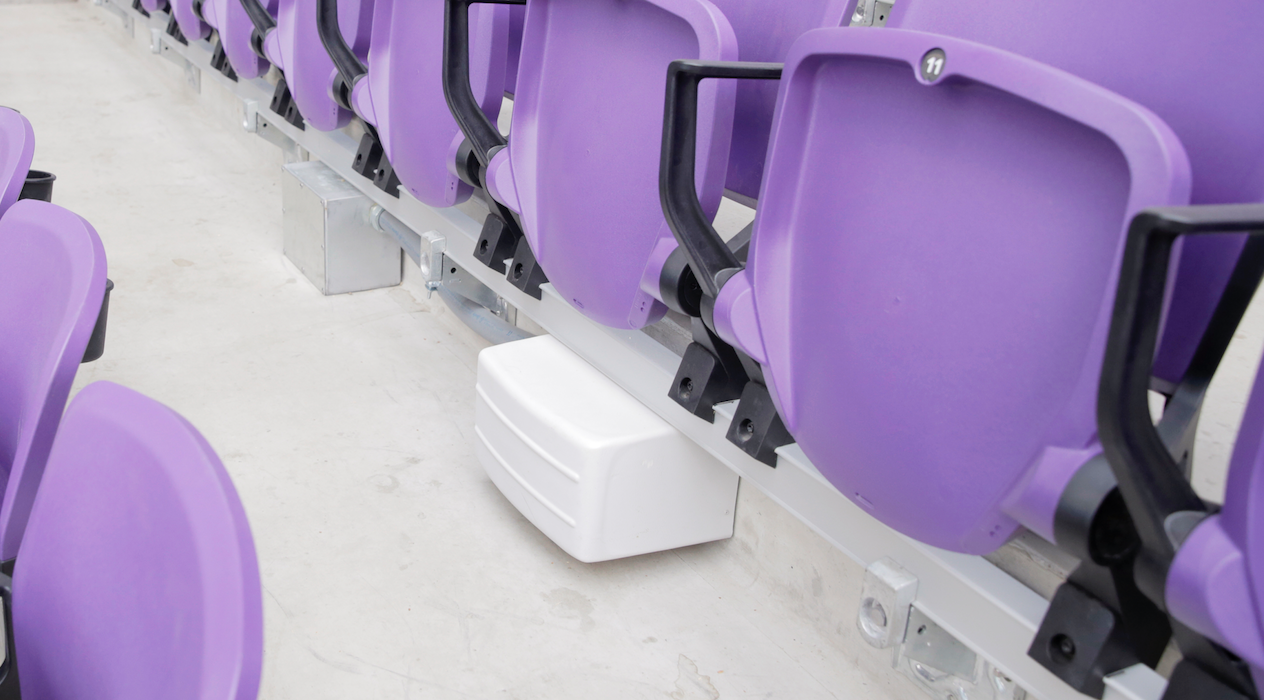
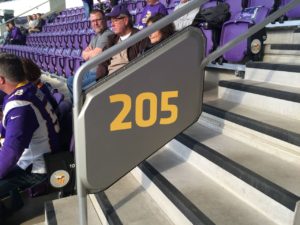
A Wi-Fi handrail enclosure at U.S. Bank Stadium in Minneapolis. Credit: Paul Kapustka, MSR (click on any photo for a larger image)

It is now official — we have a new record for most Wi-Fi data used at a single-day event, as fans at U.S. Bank Stadium in Minneapolis for Super Bowl 52 used 16.31 terabytes of data on the Wi-Fi network.

According to statistics compiled by Extreme Networks during the Philadelphia Eagles’ thrilling 41-33 victory over the New England Patriots Sunday night, the AmpThink-designed network which uses Cisco Wi-Fi gear also saw 40,033 unique users — 59 percent of the 67,612 in attendance — a new top percentage total for any single-game network experience we’ve been told about. (The Dallas Cowboys saw approximately 46,700 unique Wi-Fi users during a playoff game last season, about 50 percent of attendance at AT&T Stadium.)

The network also saw a peak concurrent connection of 25,670 users, and a peak data transfer rate of 7.867 Gbps, according to the numbers released by Extreme. Though Extreme gear was not used in the operation of the network, Extreme has a partnership deal with the NFL under which it provides the “official” network analytics reports from the Super Bowl.

The final total of 16.31 TB easily puts Super Bowl 52 ahead of the last two Super Bowls when it comes to Wi-Fi data use. Last year at NRG Stadium in Houston, there was 11.8 TB of Wi-Fi use recorded, and at Super Bowl 50 in 2016 there was 10.1 TB of Wi-Fi data used at Levi’s Stadium in Santa Clara, Calif. So in reverse chronological order, the last three Super Bowls are the top three Wi-Fi events, indicating that data demand growth at the NFL’s biggest game shows no sign of slowing down. Combined with the 50.2 TB of cellular data used in and around the stadium on game day, Super Bowl 52 saw a total of 66.51 TB of wireless traffic Sunday in Minneapolis.

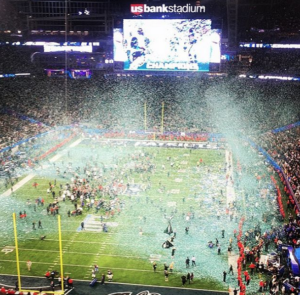
Confetti fills the air inside U.S. Bank Stadium after the Philadelphia Eagles defeated the New England Patriots in Super Bowl LII. Credit: U.S. Bank Stadium

Super Bowl 52 represented perhaps a leap of faith, in that the handrail-enclosure Wi-Fi design had not yet seen a stress test like that found at the NFL’s biggest event. Now looking ahead to hosting the 2019 Men’s NCAA Basketball Final Four, David Kingsbury, director of IT for U.S. Bank Stadium, can be forgiven for wanting to take a bit of a victory lap before we set our Wi-Fi sights on Atlanta’s Mercedes-Benz Stadium, home of Super Bowl 53.

“AmpThink, CenturyLink and Cisco designed and built a world-class wireless system for U.S. Bank Stadium that handled record-setting traffic for Super Bowl LII,’ Kingsbury said. “AmpThink president Bill Anderson and his team of amazing engineers were a pleasure to work with and the experts at Cisco Sports and Entertainment supported us throughout the multi-year planning process required for an event of this magnitude. High-density wireless networking is such a challenging issue to manage, but I am very happy with our results and wish the team in Atlanta the best next year. The bar has been raised.”

THE LATEST TOP 10 FOR WI-FI

1. Super Bowl 52, U.S. Bank Stadium, Minneapolis, Minn., Feb. 4, 2018: Wi-Fi: 16.31 TB
2. Super Bowl 51, NRG Stadium, Houston, Feb. 5, 2017: Wi-Fi: 11.8 TB
3. Super Bowl 50, Levi’s Stadium, Santa Clara, Calif., Feb. 7, 2016: Wi-Fi: 10.1 TB
4. Minnesota Vikings vs. Philadelphia Eagles, NFC Championship Game, Lincoln Financial Field, Philadelphia, Pa., Jan. 21, 2018: Wi-Fi: 8.76 TB
5. Kansas City Chiefs vs. New England Patriots, Gillette Stadium, Foxborough, Mass., Sept. 7, 2017: Wi-Fi: 8.08 TB
6. Green Bay Packers vs. Dallas Cowboys, Divisional Playoffs, AT&T Stadium, Arlington, Texas, Jan. 15, 2017: Wi-Fi: 7.25 TB
7. Southern California vs. Notre Dame, Notre Dame Stadium, South Bend, Ind., Oct. 21, 2017: 7.0 TB
8. WrestleMania 32, AT&T Stadium, Arlington, Texas, April 3, 2016: Wi-Fi: 6.77 TB
9. Super Bowl 49, University of Phoenix Stadium, Glendale, Ariz., Feb. 1, 2015: Wi-Fi: 6.23 TB
10. Georgia vs. Notre Dame, Notre Dame Stadium, South Bend, Ind., Sept. 9, 2017: Wi-Fi: 6.2 TB

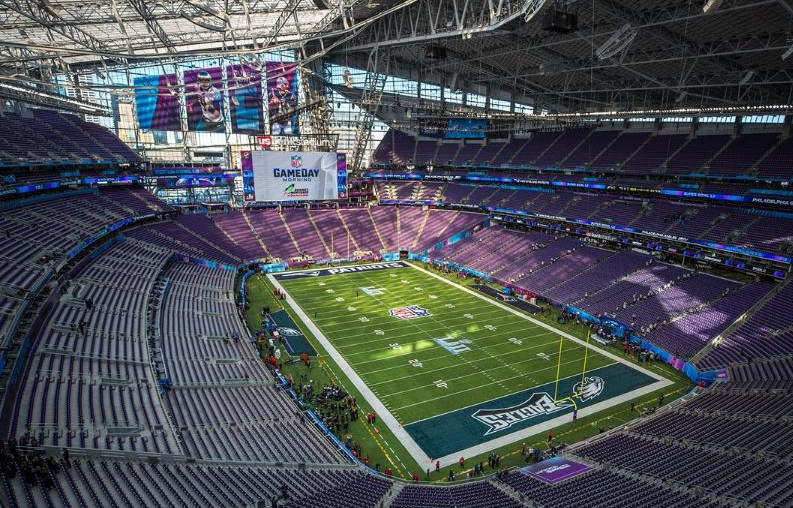
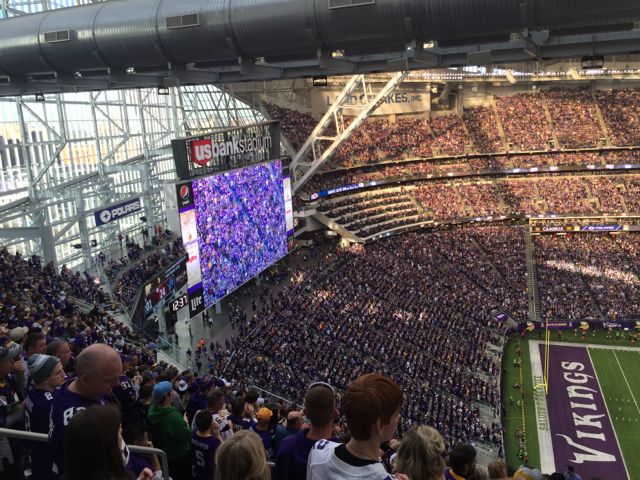
U.S. Bank Stadium in Minneapolis before the start of Super Bowl LII

Eagles see 8.76 TB of Wi-Fi data for NFC Championship game on new Panasonic network

Panasonic Everest Wi-Fi APs (lower left, middle right) mounted underneath an overhang at Lincoln Financial Field in Philadelphia. Credit: Panasonic (click on any photo for a larger image)

The Philadelphia Eagles saw 8.76 terabytes of Wi-Fi data used at Lincoln Financial Field on Jan. 21 during the Eagles’ 38-7 win over the Minnesota Vikings in the NFC Championship game, a new high in one-day Wi-Fi usage for reported marks in games not called the Super Bowl.

Though the game’s position as No. 3 on our unofficial “top Wi-Fi” list (see below) may change as we get reports from other recent NFL playoff games, the mark is nevertheless impressive, and perhaps a big confirmation metric for Panasonic’s nascent big-venue Wi-Fi business. According to Panasonic, its 654-Access Point network inside “The Linc” also saw 35,760 unique connections during the game, out of 69,596 in attendance; the network also saw a peak of 29,201 concurrent devices connected (which happened during the post-game trophy presentation), and saw peak throughput of 5.5 Gbps.

What’s most interesting about the new Panasonic network in Philadelphia is that it is a completely top-down deployment, meaning that most of the APs (especially the 200 used in the seating bowl) shoot signals down toward seats from above. While most new networks at football-sized stadiums (and some smaller arenas) have turned to under-seat or railing-mounted APs to increase network density in seating areas, Panasonic claims its new “Everest” Wi-Fi gear has antennas that can provide signals up to 165 feet away, with “electronically reconfigurable directional beam profiles” that allow for specific tuning of where the Wi-Fi signal can point to.

By also putting four separate Wi-Fi radios into each access point, Panasonic also claims it can save teams and venues money and time on Wi-Fi deployments, since fewer actual devices are needed. By comparison, other big, new network deployments like Notre Dame’s often have a thousand or more APs; Notre Dame, which uses railing-mounted APs in the seating bowl, has 685 in the seating bowl out of a total 1,096 APs. Many of the Notre Dame APs are Cisco 3800 devices, which have two Wi-Fi radios in each AP.

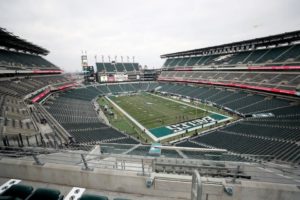
‘The Linc’ before last week’s NFC Championship game. Credit: Kiel Leggere, Eagles

Atlanta’s new Mercedes-Benz Stadium, which uses Aruba Wi-Fi gear mainly deployed under seats in the bowl, has nearly 1,800 APs, with 1,000 of those in the seating bowl.

Antennas close to fans vs. farther away

From a design and performance standpoint, the under-seat or railing-mounted “proximate” networks are built with many APs close together, with the idea that fans’ bodies will intentionally soak up some of the Wi-Fi signal, a fact that network designers use to their advantage to help eliminate interference between radios. The under-seat AP design, believed to be first widely used by AT&T Park in San Francisco and then at a larger scale at Levi’s Stadium in Santa Clara, Calif., was developed to help bring better signals to seats where overhang-mounted APs couldn’t deliver strong connectivity. Older concrete-bowl stadiums like Notre Dame’s also went with a proximate railing design for a similar lack of overhangs.

Though the Eagles’ IT team has repeatedly turned down interview requests from MSR since this summer, Danny Abelson, vice president connectivity for Panasonic Enterprise Solution Company, met with MSR last week to provide details of the deployment. Citing new, patented antenna technology developed specifically by Panasonic to solve the limitations of prior overhead gear, Abelson claims Panasonic can deliver a similar stadium experience for “two-thirds the cost” of an under-seat or railing-mount network design, with savings realized both in construction costs (since it is usually cheaper to install overhead-mounted equipment than under-seat or railing mounts due to drilling needed) and in the need for fewer actual APs, since Panasonic has four radios in its main Wi-Fi APs.

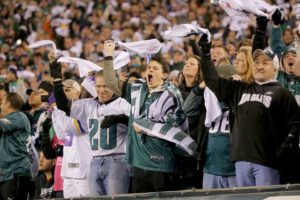
Eagles fans cheering their team to the Super Bowl. Credit: Hunter Martin, Eagles

Abelson, however, declined to provide the exact cost of the Panasonic network at Lincoln Financial Field, citing non-disclosure agreements. There are also more questions to be answered about a Panasonic deployment’s cost, including charges for management software and/or administration services. Currently, Abelson said, Panasonic includes the costs for management software and management personnel in its bids.

When it comes to how the Eagles found Panasonic, the team and the company already had an existing relationship, as Panasonic’s video-board division had previously supplied displays for the Linc. According to Abelson, Panasonic went through a performance test at several Eagles games last season, bringing in Wi-Fi gear to see if the new technology could provide coverage to areas where the Eagles said they had seen lower-quality coverage before. One of the forerunners in the NFL in bringing Wi-Fi to fans, the Eagles had previously used Extreme Networks Wi-Fi gear to build a fan-facing network in 2013. Though the Eagles would not comment about the selection process, after issuing an RFP this past offseason the team chose Panasonic for a new network, which Abelson said was deployed in three months during the football offseason.

Re-opening the debate for antenna placement?

Though Mobile Sports Report has not yet been able to get to Philadelphia to test the new network in a live game-day situation, if Panasonic’s new gear works as promises the company may find many potential interested customers, especially those who had shied away from deploying under-seat networks due to the construction issues or costs.

The Panasonic system may be of particular interest to indoor arenas, like hockey and basketball stadiums, where the gear could be potentially mounted in catwalk areas to cover seating. John Spade, CTO for the NHL’s Florida Panthers and BB&T Center in Sunrise, Fla., has tweeted favorably about a Panasonic deployment going in at the arena whose networks he oversees:

But even as the impressive 8.76 TB mark seen at the NFC Championship game now sits as the third-highest reported Wi-Fi data use event we’ve heard of (behind only the 10.1 TB of Wi-Fi seen at Super Bowl 50 and the 11.8 TB seen at Super Bowl 51), that number may fall a bit down the list if we ever get verified numbers for some network totals we’ve heard rumors about lately. (Or even any older ones! C’mon network teams: Check out the list below and let us know if we’ve missed any.)

So far this season, we haven’t gotten any reports of Wi-Fi usage out of the network team at Atlanta’s Mercedes-Benz Stadium (which recently hosted the college football playoff championship game), and we’ve only heard general talk about oversized playoff-game traffic at U.S. Bank Stadium in Minneapolis, home of Sunday’s Super Bowl 52. Like Notre Dame Stadium, U.S. Bank Stadium uses a mostly railing-mounted AP deployment in its seating bowl; both networks were designed by AmpThink. We are also still waiting for reports from last week’s AFC Championship game at Gillette Stadium, where the previous non-Super Bowl top mark of 8.08 TB was set in September; and from any games this fall at AT&T Stadium in Arlington, Texas, where the NFL’s biggest stadium has 2,567 Wi-Fi APs.

Will overhead still be able to keep up as demand for more bandwidth keeps growing? Will Panasonic’s claims of lower costs for equal performance hold up? At the very least, the performance in Philadelphia could re-open debate about whether or not you need to deploy APs closer to fans to provide a good Wi-Fi experience. If all goes well, the winners in renewed competition will be venues, teams, and ultimately, fans.

THE LATEST TOP 10 FOR WI-FI

1. Super Bowl 51, NRG Stadium, Houston, Feb. 5, 2017: Wi-Fi: 11.8 TB
2. Super Bowl 50, Levi’s Stadium, Santa Clara, Calif., Feb. 7, 2016: Wi-Fi: 10.1 TB
3. Minnesota Vikings vs. Philadelphia Eagles, NFC Championship Game, Lincoln Financial Field, Philadelphia, Pa., Jan. 21, 2018: Wi-Fi: 8.76 TB
4. Kansas City Chiefs vs. New England Patriots, Gillette Stadium, Foxborough, Mass., Sept. 7, 2017: Wi-Fi: 8.08 TB
5. Green Bay Packers vs. Dallas Cowboys, Divisional Playoffs, AT&T Stadium, Arlington, Texas, Jan. 15, 2017: Wi-Fi: 7.25 TB
6. Southern California vs. Notre Dame, Notre Dame Stadium, South Bend, Ind., Oct. 21, 2017: 7.0 TB
7. WrestleMania 32, AT&T Stadium, Arlington, Texas, April 3, 2016: Wi-Fi: 6.77 TB
8. Super Bowl 49, University of Phoenix Stadium, Glendale, Ariz., Feb. 1, 2015: Wi-Fi: 6.23 TB
9. Georgia vs. Notre Dame, Notre Dame Stadium, South Bend, Ind., Sept. 9, 2017: Wi-Fi: 6.2 TB
10. Alabama vs. Texas A&M, Kyle Field, College Station, Texas, Oct. 17, 2015: Wi-Fi: 5.7 TB

Verizon: U.S. Bank Stadium DAS already seeing more traffic than Super Bowl 51

A new Verizon DAS antenna handrail enclosure (right) at U.S. Bank Stadium in Minneapolis. (The enclosure lower left is for Wi-Fi). Credit all photos: Paul Kapustka, MSR (click on any photo for a larger image)

The trend of fans continuing to use more and more wireless data at big sporting events shows no sign of slowing down, especially after Verizon Wireless said that it’s already seeing more cellular traffic at Vikings home games this year than it saw at Super Bowl 51.

Verizon, which built the neutral-host distributed antenna system (DAS) for cellular carriers at U.S. Bank Stadium in Minneapolis, also said it increased the DAS antenna count by 48 percent at the venue this past offseason, in order to better support the expected surge coming at Super Bowl 52 on Feb. 4, 2018. At a press event at the stadium today, Verizon said it now has approximately 1,200 DAS antennas of its own at U.S. Bank Stadium.

“We’re very confident” that both the DAS and Verizon’s networks will be more than ready to handle the Super Bowl when it comes to Minneapolis at the end of this current NFL season, said Diana Scudder, executive director for network assurance at Verizon, in a phone interview earlier this week. Though the stadium opened in 2016 with a fully functional DAS, Scudder said Verizon spent the past offseason adding more capacity for its customers with additional DAS antennas in a variety of deployment methods, including antennas in enclosures both under-seat and in handrails, as well as in pole-mounted deployments along standing-room drink railings in both end zone concourses.

It’s selfie time on the drink-rail concourse area, where a DAS antenna looms on a pole behind

Though Scudder declined to say exactly how many DAS antennas there are in the building, with the new “48 percent” additional antennas Verizon said it now has 100 DAS zones throughout the venue, including the seating bowl, concourses, suites, and outdoor DAS coverage surrounding the stadium. But perhaps the most surprising reveal was that in-stadium DAS traffic at Vikings home games this season have already produced single-game numbers that Scudder said were greater than those seen inside the stadium at Super Bowl 51, held Feb. 5 at NRG Stadium in Houston. Pay attention here, because the italicized distinction is important.

Under-seat, handrail and drink-railing DAS

Given Verizon’s historic coyness on numbers, it’s no surprise that Scudder did not provide an exact number for the Vikings in-stadium DAS traffic that she said surpassed Super Bowl 51’s mark. She also didn’t disclose what the in-stadium only DAS number was for Verizon at NRG Stadium. The only reported Verizon number for DAS traffic at Super Bowl 51, 11 terabytes of traffic, includes data not just from the stadium, but also from macro network connections within a 2-mile radius of the stadium on game day, Scudder said. So far, Verizon hasn’t provided a Vikings regular-season game-day measurement for traffic outside the stadium as well. So if it’s not an apples-to-apples comparison yet, if the in-stadium marks are already higher, the bet is that whatever total number Verizon sees at Super Bowl LII, it will be greater than the 11 TB seen at Super Bowl LI.

It’s also not surprising that the DAS installation at U.S. Bank Stadium is already looking like it will surpass NRG Stadium’s marks, simply because with the advantage of greenfield construction, all networks at U.S. Bank Stadium were designed with some of the latest deployment knowledge available. At NRG Stadium, where networks were added well after construction, Verizon deployed DAS antennas under the concrete floors, an easier deployment method but one that typically produces lower throughput than other methods. And for Super Bowl 50 at Levi’s Stadium in Santa Clara, Calif., Verizon added under-seat DAS antennas in what was believed to be the first such deployment for cellular DAS.

Two DAS antennas hang from a pole above the main concourse

AmpThink, which built the Wi-Fi network in U.S. Bank Stadium relying on handrail-mounted AP enclosures, seems to have played a hand in part of Verizon’s DAS upgrade, as some of the new DAS enclosures seem to mimic the Wi-Fi ones. Scudder did say that Verizon used contractors to assist with the new antenna deployment enclosures and mounts, but did not cite AmpThink by name. The new under-seat DAS deployments and the handrail DAS deployments are Verizon-specific, meaning they are not part of the neutral host DAS that provides service for other cellular carriers.

In addition to overhead DAS antennas mounted pretty much everywhere it would make sense — below overhangs, and even in twin-antenna mounts on poles hanging down over concourse walkways — there are now a series of DAS antennas mounted on poles just above the main-concourse end-zone standing areas, where fans can lean against drink rails while watching the game. In a pregame test on Nov. 19 for a Vikings home game against the Los Angeles Rams, MSR tests saw DAS speeds of 77.35 Mpbs download and 32.40 Mbps upload on one of the end-zone concourse areas.

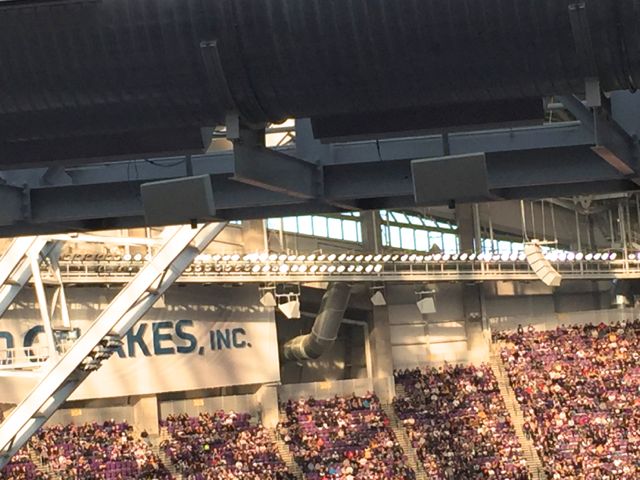
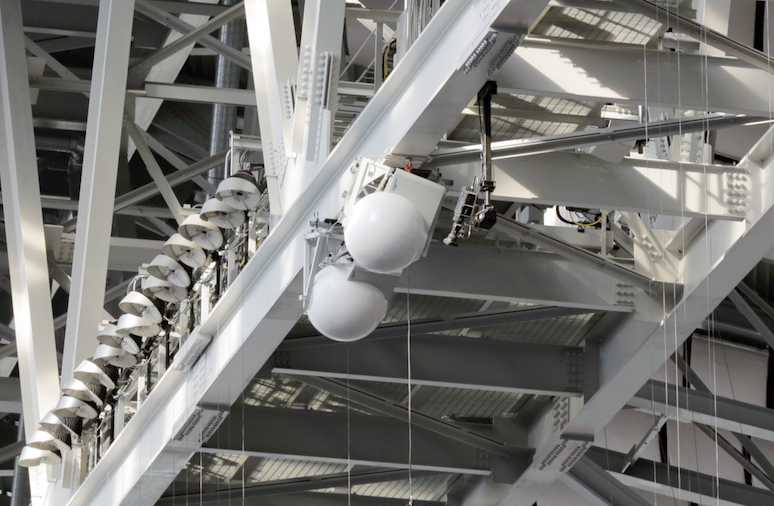
Even up in the most nosebleed of seats — in U.S. Bank Stadium’s case, section 345, which has seats almost touching the roof in the southwest corner, we got a DAS speedtest on the Verizon network of 60.87 Mbps / 44.22 Mbps, most likely from some antennas we could see mounted just above the seats on ventilation pipes a bit toward the field. And hanging from the middle of U.S. Bank Stadium’s roof are a pair of Matsing Ball antennas, which point down to provide cellular service for media and photographers on the sidelines, as well as for floor seating for concerts and other events.

Demand for bandwidth is ‘insatiable’

According to Scudder, any and all antennas are all needed, both for Vikings home games at the 66,200-seat venue, but also for the Super Bowl, where additional seating will host more fans, media and other attendees for the NFL’s championship game.

“The consumer appetite [for wireless data] is insatiable,” Scudder said, noting that these days Verizon pretty much plans to see double whatever the last Super Bowl saw for each following big game. Verizon’s deployments don’t end at U.S. Bank Stadium’s walls, either. According to Scudder over the past 2 years Verizon engineers have been busy adding capacity all over Minneapolis, including in downtown areas, at the Minneapolis airport, and at the nearby Mall of America.

“We’ve been partnering with the Twin Cities for 2 years now and they are very receptive and want to have the latest technology here,” Scudder said. Scudder also said that all the improvements, in DAS, small cell deployments and macro towers, will remain as permanent solutions, helping keep Minneapolis a Super-connected city even after the big game is over.

DAS antennas hang down from the overhang above a suite area

Even at the highest elevation seats in the venue, DAS coverage is excellent, provided in this case by antennas mounted on the ventilation pipes above (see next photo for close-up)

DAS antennas seen mounted below ventilation pipes


Two ‘Matsing Ball’ antennas hanging from center roof beams (this photo courtesy Verizon)

Under-seat DAS antenna (this photo courtesy Verizon)

Super Bowl LI Wi-Fi sees drop in average per-fan use total

Under seat Wi-Fi APs visible down seating row at NRG Stadium. Credit: 5 Bars

Under seat Wi-Fi APs visible down seating row at NRG Stadium. Credit: 5 Bars

While Super Bowl LI in Houston set records for most total Wi-Fi used in a single day event, the actual amount of average Wi-Fi data used per connected fan actually dropped from the previous year’s game, from about 370 megabytes per user at Super Bowl 50 to about 333 MB per user for Super Bowl 51.

Using official totals provided by the NFL’s official analytics provider, Extreme Networks, there was a total of 11.8 TB of data used on the Wi-Fi network at NRG Stadium in Houston during Super Bowl 51, compared to 10.1 TB used during Super Bowl 50 at Levi’s Stadium in Santa Clara, Calif.

While the total Wi-Fi data number represents approximately a 17 percent increase from Super Bowl 50 to Super Bowl 51, the most recent game had 35,430 users who connected at least once to the network, an almost 30 percent leap from Super Bowl 50’s 27,316 unique users. So while Super Bowl 51 had more unique users (and more peak concurrent users as well) and a higher data total, the average amount of data used per connected fan decreased, from about 370 MB per user to about 333 MB per user.

Data for Super Bowls in years past is thin (mainly because stadium Wi-Fi didn’t really exist), but it’s certainly the first time in very recent history that the per-user average has dropped from one Super Bowl to the next. Super Bowl 49, held at the University of Phoenix Stadium in Glendale, Ariz., saw a total of 6.23 TB of Wi-Fi used, with 25,936 unique users, for a per-user average total of 240 MB. We don’t have any stats for unique users at Super Bowl XLVIII in MetLife Stadium, but with the total Wi-Fi used there at 3.2 TB the average was also presumably much lower as well, unless there were also 50 percent fewer connected users.

Did autoconnect drop the average?

Wi-Fi gear visible above concourse kiosk at NRG Stadium. Credit: 5 Bars

Wi-Fi gear visible above concourse kiosk at NRG Stadium. Credit: 5 Bars

The drop in per-user average data for Wi-Fi is curious when compared to the huge leap in overall DAS stats for the last two Super Bowls, with Super Bowl 51 checking in at 25.8 TB of data, a figure that does not include statistics from T-Mobile, which is declining to report its data total from the game. At Super Bowl 50, all four top wireless carriers combined saw 15.9 TB, so the total for Super Bowl 51 is about 62 percent higher — and if you add in the estimated 3-4 TB that was likely recorded by T-Mobile, that leap is even bigger.

Unfortunately cellular carriers do not provide the exact number of connected users, so there is no per-user average data total available. It would be interesting to know if the expanded DAS preparations made at Super Bowl 50 and at Super Bowl 51 actually connected more total users, or allowed users to use more data per user. We have a request with Verizon for more stats, but it may be a long wait.

One theory we have here at MSR is that it’s possible that a large number of autoconnected devices may have increased the unique-user total while not necessarily adding to the overall Wi-Fi data-used total. In our reporting about the NRG Stadium network we noted that Verizon, which helped pay for the Wi-Fi deployment, had reserved 40 percent of the Wi-Fi capacity for its customers, many of whom could have been autoconnected to the network even without them knowing. We have asked both Extreme and Verizon for a breakdown on Verizon users vs. other wireless customer users on the Wi-Fi network, but have not yet received a response.

Update: Super Bowl LI breaks 37 TB wireless mark

NRG Stadium during Super Bowl LI. Credit: AP / Morry Gash/ Patriots.com

NRG Stadium during Super Bowl LI. Credit: AP / Morry Gash/ Patriots.com

It’s official now, and without any doubt Super Bowl LI broke the single-day wireless data use mark, with at least 37.6 terabytes used.

The official stats for Wi-Fi at NRG Stadium are finally in, with a mark of 11.8 TB, which is a bit more than the 10.1 TB recorded at last year’s Super Bowl at Levi’s Stadium, the previous top mark. The official stats were reported Thursday by Wi-Fi gear provider Extreme Networks, which posted them on the company website.

New DAS records even without any T-Mobile stats

On the cellular side Verizon Wireless, AT&T and Sprint all set new records, with Verizon reporting 11 TB of use and AT&T reporting 9.8 TB, while Sprint (which ran on its own DAS at NRG Stadium) hit 5 TB. At last year’s Super Bowl Verizon (7 TB) and AT&T (5.2 TB) had set their respective previous high-water marks, while Sprint had reported 1.6 TB at Levi’s Stadium. Even without numbers from T-Mobile the current DAS count is 25.8 TB, much higher than the 15.9 TB cellular total from Super Bowl 50.

(Unfortunately, T-Mobile right now is refusing to provide a total data number — a spokesperson who didn’t want to be quoted claimed on a phone call that the total data number was “not relevant,” and that T-Mobile would not provide a final number. However, we did see a blog post from the company claiming it passed its 2.1 TB total from last year by halftime, so at the very least we could probably accurately add at least another 2.2 TB to the overall DAS total. So we may see a combined total of all cellular and Wi-Fi nearing 40 TB before it’s all counted up, approved or not.)

One of our close friends in the business was at the game, and was kind enough to send us a bunch of Wi-Fi speedtests from NRG Stadium (go check our Twitter timeline at @paulkaps to see the tests linked).

What was interesting was watching the speeds go down when “spike” events occurred, like touchdowns and the end of Lady Gaga’s halftime show. The incredible comeback by the New England Patriots to claim a 34-28 overtime victory kept the network busy through the night, and after the game as well during the awards ceremony.

Tom Brady with the Lombardi Trophy. Credit: AP / Patriots.com

Tom Brady with the Lombardi Trophy. Credit: AP / Patriots.com

New record for take rate

According to Extreme, fans at NRG Stadium also set new high-water marks for unique connections to the network as well as for peak concurrent connections. At Super Bowl LI Extreme said it saw 35,430 fans connect to the network, a 49 percent take rate with the attendance of 71,795. Last year at Super Bowl 50 at Levi’s Stadium a total of 27,316 fans connected to the network out of 71,088 attending, a 38 percent take rate.

On the peak concurrent-connection side, Super Bowl LI set a new mark with 27,191 fans connected at one time, according to Extreme. At the Super Bowl 50, the top concurrent-connected mark was 20,300.

Extreme also released some social-media statistics, claiming that 1.7 TB of the Wi-Fi total was social media traffic. Leading the way in order of most users to fewer were Facebook, Instagram, Snapchat and Twitter. Interestingly, Snapchat consumed almost as much data as Facebook, according to pie graphs in the Extreme infographic, which did not provide any actual numbers for those totals. Extreme also did not report what is typically the highest use of bandwidth in any stadium situation, that being Apple iOS updates and Google Gmail activity.

The NFL, which had its own game-day application for Super Bowl LI, has not released any statistics about app use.

Congrats to all the carriers, integrator 5 Bars and Wi-Fi gear supplier Extreme Networks.

THE NEW TOP 6 FOR WI-FI

1. Super Bowl 51, NRG Stadium, Houston, Feb. 5, 2017: Wi-Fi: 11.8 TB
2. Super Bowl 50, Levi’s Stadium, Santa Clara, Calif., Feb. 7, 2016: Wi-Fi: 10.1 TB
3. WrestleMania 32, AT&T Stadium, Arlington, Texas, April 3, 2016: Wi-Fi: 6.77 TB
4. Super Bowl 49, University of Phoenix Stadium, Glendale, Ariz., Feb. 1, 2015: Wi-Fi: 6.23 TB
5. Alabama vs. Texas A&M, Kyle Field, College Station, Texas, Oct. 17, 2015: Wi-Fi: 5.7 TB
6. Pittsburgh Steelers vs. New England Patriots, AFC Championship Game, Gillette Stadium, Foxborough, Mass., Jan. 22, 2017: Wi-Fi: 5.11 TB

THE NEW TOP 4 FOR TOTAL USAGE

1. Super Bowl 51, NRG Stadium, Houston, Feb. 5, 2017: Wi-Fi: 11.8; DAS: 25.8 TB**; Total: 37.6 TB
2. Super Bowl 50, Levi’s Stadium, Santa Clara, Calif., Feb. 7, 2016: Wi-Fi: 10.1 TB; DAS: 15.9 TB; Total: 26 TB
3. Super Bowl XLIX, University of Phoenix Stadium, Glendale, Ariz., Feb. 1, 2015: Wi-Fi: 6.23 TB; DAS: 6.56 TB**; Total: 12.79 TB**
4. WrestleMania 32, AT&T Stadium, Arlington, Texas, April 3, 2016: Wi-Fi: 6.77 TB; DAS: 1.9 TB*; Total: 8.6 TB*

* = AT&T DAS stats only
** = AT&T, Verizon Wireless and Sprint DAS stats only

https://duwit.ukdw.ac.id/document/pengadaan/slot777/

https://mtsnupakis.sch.id/wp-content/zeusslot/

https://insankamilsidoarjo.sch.id/wp-content/slot-zeus/

https://smpbhayangkari1sby.sch.id/wp-content/slot-zeus/

https://alhikamsurabaya.sch.id/wp-content/slot-thailand/

https://mtsnupakis.sch.id/wp-content/bonus-new-member/

https://smptagsby.sch.id/wp-content/slot-bet-200/

https://lookahindonesia.com/wp-content/bonus-new-member/

https://ponpesalkhairattanjungselor.sch.id/wp-content/mahjong-slot/

https://mtsnupakis.sch.id/wp-content/slot777/

https://sdlabum.sch.id/wp-content/slot777/

https://sdlabumblitar.sch.id/wp-content/bonus-new-member/

https://sdlabumblitar.sch.id/wp-content/spaceman/

https://paudlabumblitar.sch.id/wp-content/spaceman/