Average per-fan Wi-Fi use total jumps again at Super Bowl 52

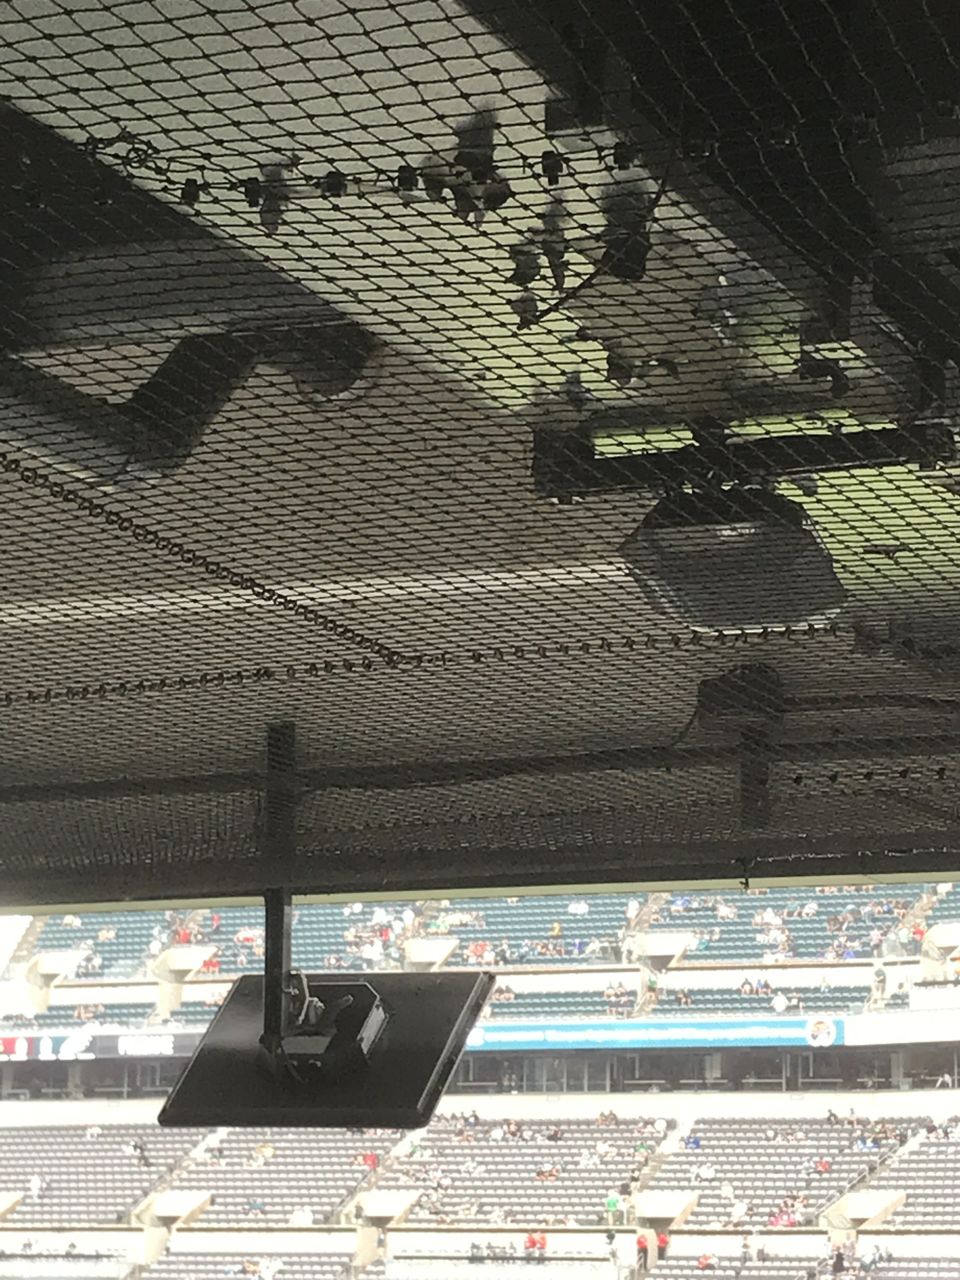
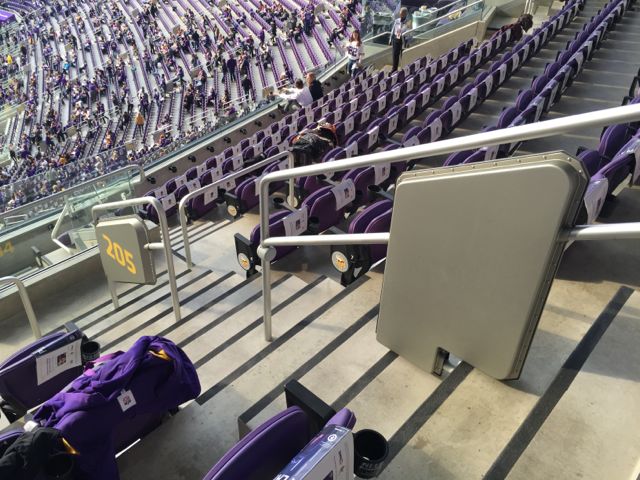
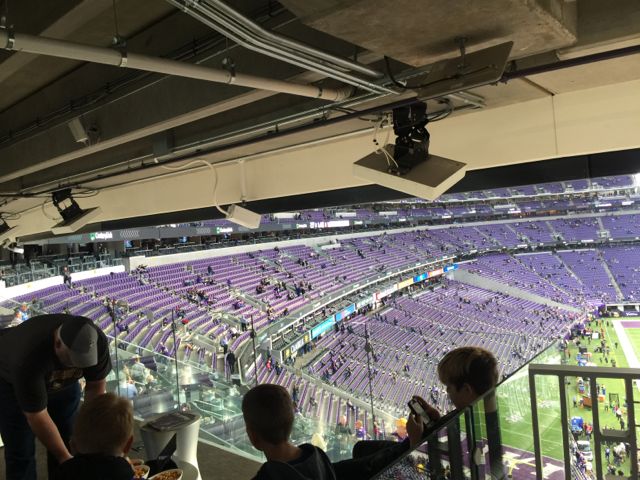
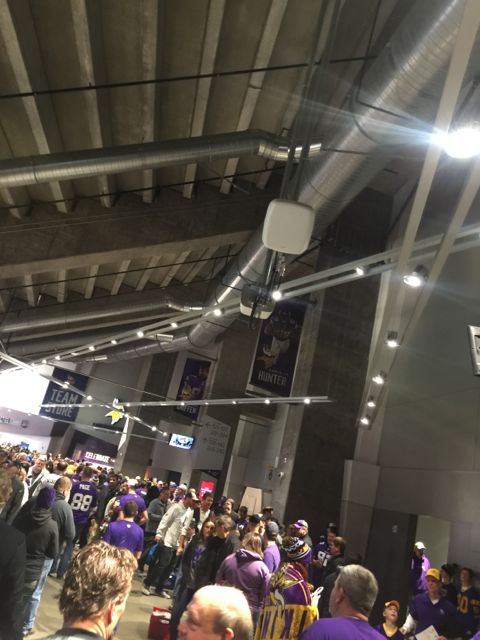
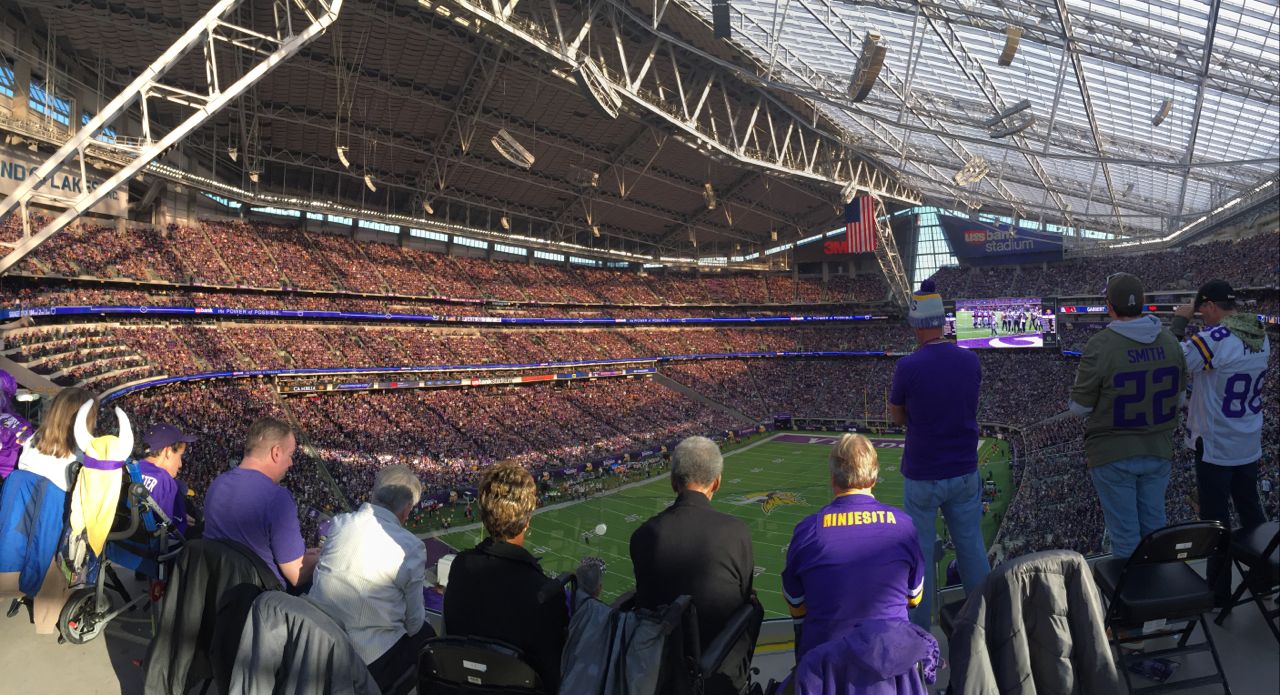
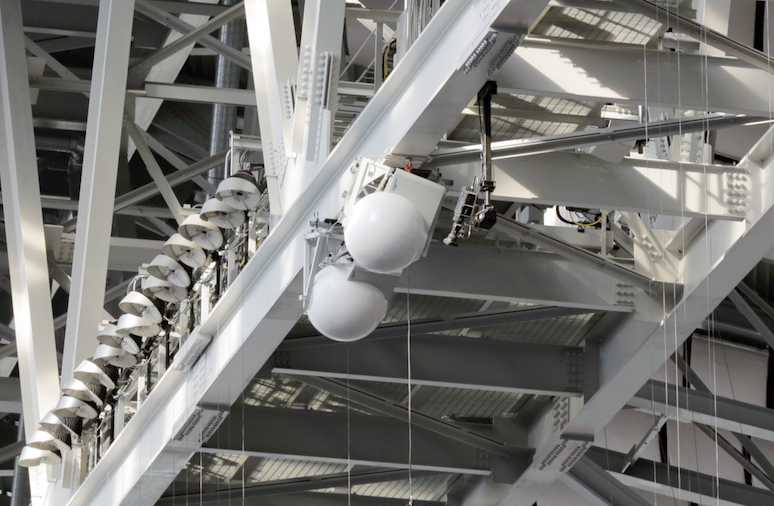
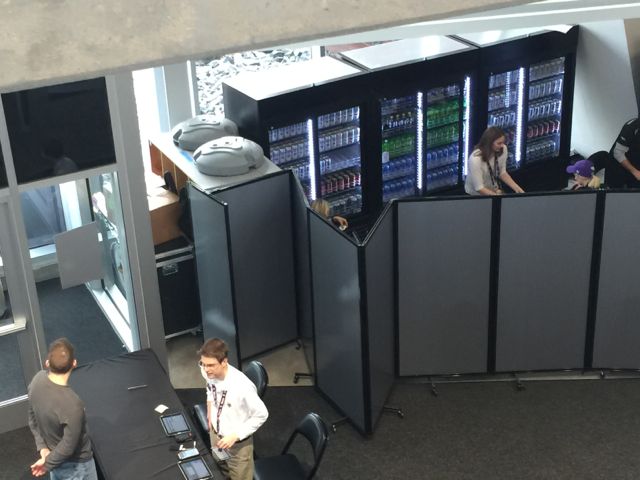
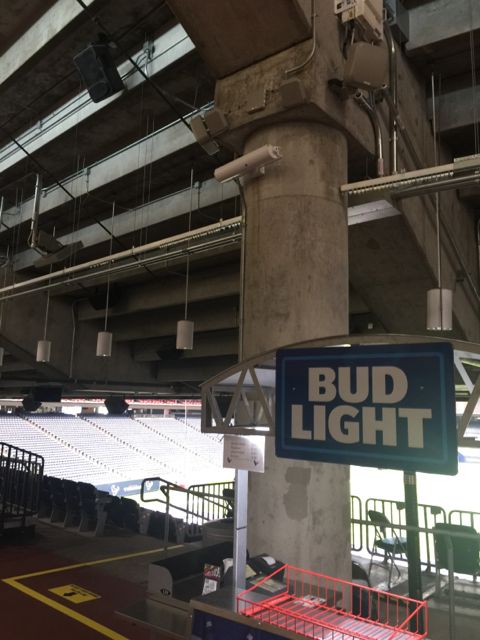
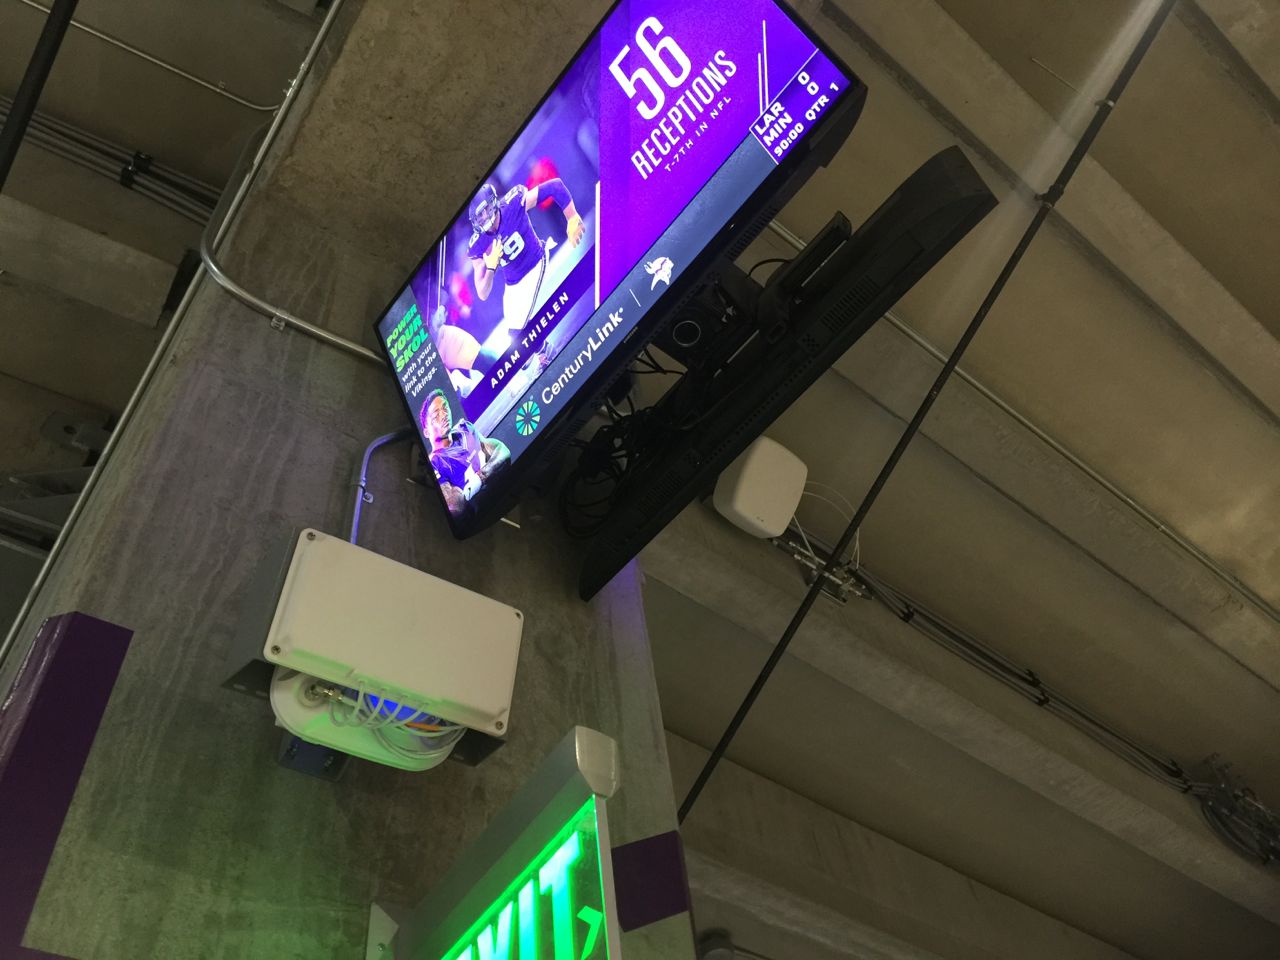
Seen in the main concourse at U.S. Bank Stadium: Two IPTV screens, one Wi-Fi AP and a DAS antenna. Credit: Paul Kapustka, MSR

After a year where the actual amount of average Wi-Fi data used per connected fan at the Super Bowl dropped, the trend of more data used per fan reversed itself again to a new peak at Super Bowl 52, with an average total of 407.4 megabytes per user.

Even though the number of unique connections to the Wi-Fi network at U.S. Bank Stadium for Super Bowl 52 also increased to a record 40,033 users (according to the official statistics compiled by Extreme Networks), the jump from 11.8 terabytes of Wi-Fi data used at Super Bowl 51 to 16.31 TB used at Super Bowl 52 pushed the average per-user number to the top, surpassing the 333 MB per user number from Super Bowl 51, as well as the 370 MB per user mark seen at Super Bowl 50.

While this statistic has not ever been called out by the Extreme Networks Super Bowl compilations, we here at MSR think it is a vital mark since it shows that even with more users on the network those connected users are still using more data. That means that IT departments at venues everywhere should probably still plan for no letup in the overall continued growth in demand for bandwidth at large-venue events, especially at “bucket list” events like the Super Bowl.

Last year we guessed the drop in per-user totals from Super Bowl 50 to Super Bowl 51 might have been due to a larger number of autoconnected users, but we never got an answer from the Extreme Networks team when we asked that question. At U.S. Bank Stadium there was also an autoconnect feature to the Wi-Fi for Verizon Wireless customers, but it didn’t seem to affect the per-user total mark.

Eagles see 8.76 TB of Wi-Fi data for NFC Championship game on new Panasonic network

Panasonic Everest Wi-Fi APs (lower left, middle right) mounted underneath an overhang at Lincoln Financial Field in Philadelphia. Credit: Panasonic (click on any photo for a larger image)

The Philadelphia Eagles saw 8.76 terabytes of Wi-Fi data used at Lincoln Financial Field on Jan. 21 during the Eagles’ 38-7 win over the Minnesota Vikings in the NFC Championship game, a new high in one-day Wi-Fi usage for reported marks in games not called the Super Bowl.

Though the game’s position as No. 3 on our unofficial “top Wi-Fi” list (see below) may change as we get reports from other recent NFL playoff games, the mark is nevertheless impressive, and perhaps a big confirmation metric for Panasonic’s nascent big-venue Wi-Fi business. According to Panasonic, its 654-Access Point network inside “The Linc” also saw 35,760 unique connections during the game, out of 69,596 in attendance; the network also saw a peak of 29,201 concurrent devices connected (which happened during the post-game trophy presentation), and saw peak throughput of 5.5 Gbps.

What’s most interesting about the new Panasonic network in Philadelphia is that it is a completely top-down deployment, meaning that most of the APs (especially the 200 used in the seating bowl) shoot signals down toward seats from above. While most new networks at football-sized stadiums (and some smaller arenas) have turned to under-seat or railing-mounted APs to increase network density in seating areas, Panasonic claims its new “Everest” Wi-Fi gear has antennas that can provide signals up to 165 feet away, with “electronically reconfigurable directional beam profiles” that allow for specific tuning of where the Wi-Fi signal can point to.

By also putting four separate Wi-Fi radios into each access point, Panasonic also claims it can save teams and venues money and time on Wi-Fi deployments, since fewer actual devices are needed. By comparison, other big, new network deployments like Notre Dame’s often have a thousand or more APs; Notre Dame, which uses railing-mounted APs in the seating bowl, has 685 in the seating bowl out of a total 1,096 APs. Many of the Notre Dame APs are Cisco 3800 devices, which have two Wi-Fi radios in each AP.

‘The Linc’ before last week’s NFC Championship game. Credit: Kiel Leggere, Eagles

Atlanta’s new Mercedes-Benz Stadium, which uses Aruba Wi-Fi gear mainly deployed under seats in the bowl, has nearly 1,800 APs, with 1,000 of those in the seating bowl.

Antennas close to fans vs. farther away

From a design and performance standpoint, the under-seat or railing-mounted “proximate” networks are built with many APs close together, with the idea that fans’ bodies will intentionally soak up some of the Wi-Fi signal, a fact that network designers use to their advantage to help eliminate interference between radios. The under-seat AP design, believed to be first widely used by AT&T Park in San Francisco and then at a larger scale at Levi’s Stadium in Santa Clara, Calif., was developed to help bring better signals to seats where overhang-mounted APs couldn’t deliver strong connectivity. Older concrete-bowl stadiums like Notre Dame’s also went with a proximate railing design for a similar lack of overhangs.

Though the Eagles’ IT team has repeatedly turned down interview requests from MSR since this summer, Danny Abelson, vice president connectivity for Panasonic Enterprise Solution Company, met with MSR last week to provide details of the deployment. Citing new, patented antenna technology developed specifically by Panasonic to solve the limitations of prior overhead gear, Abelson claims Panasonic can deliver a similar stadium experience for “two-thirds the cost” of an under-seat or railing-mount network design, with savings realized both in construction costs (since it is usually cheaper to install overhead-mounted equipment than under-seat or railing mounts due to drilling needed) and in the need for fewer actual APs, since Panasonic has four radios in its main Wi-Fi APs.

Eagles fans cheering their team to the Super Bowl. Credit: Hunter Martin, Eagles

Abelson, however, declined to provide the exact cost of the Panasonic network at Lincoln Financial Field, citing non-disclosure agreements. There are also more questions to be answered about a Panasonic deployment’s cost, including charges for management software and/or administration services. Currently, Abelson said, Panasonic includes the costs for management software and management personnel in its bids.

When it comes to how the Eagles found Panasonic, the team and the company already had an existing relationship, as Panasonic’s video-board division had previously supplied displays for the Linc. According to Abelson, Panasonic went through a performance test at several Eagles games last season, bringing in Wi-Fi gear to see if the new technology could provide coverage to areas where the Eagles said they had seen lower-quality coverage before. One of the forerunners in the NFL in bringing Wi-Fi to fans, the Eagles had previously used Extreme Networks Wi-Fi gear to build a fan-facing network in 2013. Though the Eagles would not comment about the selection process, after issuing an RFP this past offseason the team chose Panasonic for a new network, which Abelson said was deployed in three months during the football offseason.

Re-opening the debate for antenna placement?

Though Mobile Sports Report has not yet been able to get to Philadelphia to test the new network in a live game-day situation, if Panasonic’s new gear works as promises the company may find many potential interested customers, especially those who had shied away from deploying under-seat networks due to the construction issues or costs.

The Panasonic system may be of particular interest to indoor arenas, like hockey and basketball stadiums, where the gear could be potentially mounted in catwalk areas to cover seating. John Spade, CTO for the NHL’s Florida Panthers and BB&T Center in Sunrise, Fla., has tweeted favorably about a Panasonic deployment going in at the arena whose networks he oversees:

But even as the impressive 8.76 TB mark seen at the NFC Championship game now sits as the third-highest reported Wi-Fi data use event we’ve heard of (behind only the 10.1 TB of Wi-Fi seen at Super Bowl 50 and the 11.8 TB seen at Super Bowl 51), that number may fall a bit down the list if we ever get verified numbers for some network totals we’ve heard rumors about lately. (Or even any older ones! C’mon network teams: Check out the list below and let us know if we’ve missed any.)

So far this season, we haven’t gotten any reports of Wi-Fi usage out of the network team at Atlanta’s Mercedes-Benz Stadium (which recently hosted the college football playoff championship game), and we’ve only heard general talk about oversized playoff-game traffic at U.S. Bank Stadium in Minneapolis, home of Sunday’s Super Bowl 52. Like Notre Dame Stadium, U.S. Bank Stadium uses a mostly railing-mounted AP deployment in its seating bowl; both networks were designed by AmpThink. We are also still waiting for reports from last week’s AFC Championship game at Gillette Stadium, where the previous non-Super Bowl top mark of 8.08 TB was set in September; and from any games this fall at AT&T Stadium in Arlington, Texas, where the NFL’s biggest stadium has 2,567 Wi-Fi APs.

Will overhead still be able to keep up as demand for more bandwidth keeps growing? Will Panasonic’s claims of lower costs for equal performance hold up? At the very least, the performance in Philadelphia could re-open debate about whether or not you need to deploy APs closer to fans to provide a good Wi-Fi experience. If all goes well, the winners in renewed competition will be venues, teams, and ultimately, fans.

THE LATEST TOP 10 FOR WI-FI

1. Super Bowl 51, NRG Stadium, Houston, Feb. 5, 2017: Wi-Fi: 11.8 TB
2. Super Bowl 50, Levi’s Stadium, Santa Clara, Calif., Feb. 7, 2016: Wi-Fi: 10.1 TB
3. Minnesota Vikings vs. Philadelphia Eagles, NFC Championship Game, Lincoln Financial Field, Philadelphia, Pa., Jan. 21, 2018: Wi-Fi: 8.76 TB
4. Kansas City Chiefs vs. New England Patriots, Gillette Stadium, Foxborough, Mass., Sept. 7, 2017: Wi-Fi: 8.08 TB
5. Green Bay Packers vs. Dallas Cowboys, Divisional Playoffs, AT&T Stadium, Arlington, Texas, Jan. 15, 2017: Wi-Fi: 7.25 TB
6. Southern California vs. Notre Dame, Notre Dame Stadium, South Bend, Ind., Oct. 21, 2017: 7.0 TB
7. WrestleMania 32, AT&T Stadium, Arlington, Texas, April 3, 2016: Wi-Fi: 6.77 TB
8. Super Bowl 49, University of Phoenix Stadium, Glendale, Ariz., Feb. 1, 2015: Wi-Fi: 6.23 TB
9. Georgia vs. Notre Dame, Notre Dame Stadium, South Bend, Ind., Sept. 9, 2017: Wi-Fi: 6.2 TB
10. Alabama vs. Texas A&M, Kyle Field, College Station, Texas, Oct. 17, 2015: Wi-Fi: 5.7 TB

‘Super’ Wi-Fi and DAS at U.S. Bank Stadium ready for Super Bowl 52

A look at downtown Minneapolis from inside U.S. Bank Stadium. Credit all photos: Paul Kapustka, MSR (click on any photo for a larger image)

After Sunday’s stunning last-second victory, the Minnesota Vikings are one step closer to becoming the first team to play a Super Bowl in its own home stadium. Should the Vikings beat the Eagles in Philadelphia this weekend, Super Bowl 52 visitors should prepare for a true Norse experience inside U.S. Bank Stadium, with repeated blasts from the oversize “Gjallarhorn” and a fire-breathing dragon ship that will launch the home team onto the field. Skol!

But even if the hometown team falls short of making the big game this season, on Feb. 4, 2018 the stadium itself should do Minneapolis proud, especially when it comes to wireless connectivity. With two full regular seasons of football and numerous other events to test the networks’ capacity, both the Wi-Fi and DAS networks inside the 66,655-seat U.S. Bank Stadium appear more than ready to handle what is usually the highest single-day bandwidth stress test, namely the NFL’s yearly championship game. (Though the selfies and uploads following Sunday’s walk-off touchdown toss may have provided an early indicator of massive network use!)

In a mid-November visit to U.S. Bank Stadium for a Vikings home game against the Los Angeles Rams, Mobile Sports Report found robust coverage on both the Wi-Fi and cellular networks all around the inside of the stadium, with solid performance even amidst thick crowds of fans and even in the highest reaches of the seating bowl. Speedtests on the Wi-Fi network, built by AmpThink using Cisco gear, regularly hit marks of 40 to 50-plus Mbps in most areas, with one reading reaching 85 Mbps for download speeds.

And on the DAS side of things, Verizon Wireless, which built the neutral-host network inside U.S. Bank Stadium, said in December that it has already seen more cellular traffic on its network for a Vikings home game this season than it saw at NRG Stadium for Super Bowl LI last February. With 1,200 total antennas — approximately 300 of which were installed this past offseason — Verizon said it is ready to handle even double the traffic it saw at last year’s game, when it reported carrying 11 terabytes of data on stadium and surrounding macro networks.

Good connectivity right inside the doors

Editor’s note: This profile is from our most recent STADIUM TECH REPORT for Winter 2017-18, which is available for FREE DOWNLOAD from our site. This issue has an in-depth look at the wireless networks at U.S. Bank Stadium in Minneapolis, as well as profiles of network deployments at the brand-new Little Caesars Arena, the Las Vegas Convention Center, and Orlando City Stadium! DOWNLOAD YOUR FREE COPY today!

A new Verizon DAS antenna handrail enclosure (right) at U.S. Bank Stadium in Minneapolis. (The enclosure lower left is for Wi-Fi).

James Farstad, chief technology advisor for the Minnesota Sports Facilities Authority (MSFA), the entity that owns U.S. Bank Stadium, said he and his group are “very pleased” with the state of the wireless networks inside the venue heading toward its Super Bowl date.

“You’re never really satisfied, because you want it to be the best it can be,” said Farstad in an interview during our November visit to Minneapolis. “But generally speaking, we’re very pleased with the state of the networks.”

Those networks are tested the very moment the Vikings open the doors for home games, especially in warmer weather when the signature big glass doors — five of them, all 55 feet wide and ranging in height from 75 to 95 feet — swing out to welcome fans. As the entry that points toward downtown, the west gate can account for as much as 70 percent of the fans arriving, according to the Vikings, putting a big crush on the wireless networks in the doorway area.

To help keep people connected in crowded situations, Verizon deployed extra DAS antennas on short poles in front of both the west and east end zone concourse areas, part of a 48 percent increase in overall DAS antenna numbers added during the football offseason. Even with thick crowds streaming into the stadium, we still got a DAS speedtest of 77.35 Mbps download and 32.40 Mbps upload on the concourse just inside the west doors, and just below the Gjallarhorn.

Walking around the main level concourse, connectivity hardware is easy to see if you know what you’re looking for; part of the extensive DAS coverage includes dual antennas hanging off a single pole above wide walkway segments. And in one instance, we saw a good example of aesthetic integration, with a Wi-Fi AP attached just behind two IPTV screens, with a beacon attached to the side and a DAS antenna mounted just above everything else.

First big test of railing-mounted Wi-Fi?

Moving into the seating bowl, visitors may not know that many of the Wi-Fi network’s 1,300 APs are hiding there in plain sight — inside silver handrail enclosures, many of which now sport bright, bold section numbers to help fans find their seats. Believed to be the first big football-sized stadium that relied mainly on railing-mounted APs, the proximate network design from AmpThink is proving to be a winner in performance, producing regular-season game data totals of around 3 terabytes per event and maybe more importantly, keeping an optimal number of fans attached to the AP closest to them for the speediest connection.

Top-down antennas provide coverage for suite seating

Sitting next to AmpThink president Bill Anderson in the stadium’s press box you get a great view of the field, but it’s doubtful Anderson watches much football action given that he spends most of a game day glued to a screen that shows live detailed performance for every Wi-Fi AP in the building. While the analytics program produces a wealth of interesting data, the one metric that keeps Anderson’s attention is the one showing how many fans are connected to each AP, a number that will be no more than 50 and ideally somewhere around 25 connections if the network is performing as it should be.

On the day we visited, on Anderson’s screen there was one AP showing more than 200 devices trying to connect to it, an issue Anderson noted for immediate problem-solving. But with only a handful of others showing more than 50 connections, Anderson was confident that AmpThink has been able to figure out how to solve for the main dilemma for Wi-Fi in large enclosed structures, namely keeping APs from interfering with each
other. The large clear-plastic roof and wall areas at U.S. Bank Stadium don’t help, since they reflect RF signals to add to the network design degree of difficulty.

But the multiple railing-mount network design – which AmpThink duplicated at Notre Dame University, whose new network is seeing the highest-ever data totals seen at collegiate events – seems to be fulfilling AmpThink’s goal to produce networks with steady AP loads and consistent, high-density throughput in extremely challenging environments. The railing-mounted APs provide connectivity that couldn’t be delivered by overhead antennas, like in Notre Dame’s open concrete bowl and in U.S. Bank Stadium’s similar wide-open seating area, where no overhead structure is within 300 feet of a seat.

Two DAS antennas hang from a pole above the main concourse

“I think we have a network strategy that produces good uniform performance” in venues like U.S. Bank Stadium, Anderson said. “It’s pretty darn exciting to have a formula that works.”

More antennas get DAS ready for big game

And even though Verizon knew the Super Bowl was coming to U.S. Bank Stadium when it built the neutral host DAS for the 2016 opening, it came right back this past offseason and added approximately another 300 new antennas (mainly for its own use and not for the shared DAS), all in the name of unstoppable demand for mobile bandwidth from fans attending events.

Diana Scudder, executive director for network assurance at Verizon, said in a phone interview that “the consumer appetite [for wireless data] is insatiable,” especially at the NFL’s biggest game, where DAS use has grown at a fast clip the past few years. Scudder said these days Verizon pretty much plans to see double whatever the last Super Bowl saw for each following big game, and adds network capacity accordingly. Verizon’s numbers from the past three Super Bowls are a good guide, with the carrier reporting 4.1 TB used at Super Bowl 49, 7 TB at Super Bowl 50, and 11 TB at Super Bowl 51.

AmpThink’s handrail-mounted AP enclosures seem to have played a hand in part of Verizon’s DAS upgrade, as some of the new DAS enclosures seem to mimic the Wi-Fi ones with their smaller silver enclosures. Scudder did say that Verizon used contractors to assist with the new antenna deployment enclosures and mounts, but did not cite AmpThink by name. Verizon also deployed some under-seat antenna enclosures for its upgrade, a tactic the company also used for Super Bowl 50 at Levi’s Stadium in Santa Clara, Calif.

Even up in the most nosebleed of seats — in U.S. Bank Stadium’s case, section 345, which has seats almost touching the roof in the southwest corner, we got a DAS speedtest on the Verizon network of 60.87 Mbps / 44.22 Mbps, most likely from some antennas we could see mounted just above the seats on ventilation pipes a bit toward the field. And hanging from the middle of U.S. Bank Stadium’s roof are a pair of Matsing Ball antennas, which point down to provide cellular service for media and photographers on the sidelines, as well as for floor seating for concerts and other events.

Ready to add more bandwidth on the fly

Even less unseen and probably not appreciated until it’s needed is the stadium’s backbone bandwidth, provided by sponsoring partner CenturyLink.

A Wi-Fi enclosure in section 345, near the stadium’s roof

Though some stadiums are touting 100 Gbps pipes coming in, the U.S. Bank Stadium setup makes the venue its own ISP, according to Farstad.

With six 10-Gbps pipes that are always active — and on two separate network infrastructures for redundancy — the stadium can turn up its bandwidth on the fly, a test the venue got on its first public event.

According to Farstad, when U.S. Bank Stadium opened for the first time with a soccer game on Aug. 3, 2016, the stadium operators expected about 25,000 fans might show up for a clash between Chelsea and AC Milan. But a favorable newspaper article about the stadium led to more than 64,000 fans in the house, a surge that backed up the light-rail trains and saw the concession stands run out of food.

“We were watching the Wi-Fi system during the first break [in the soccer game] and it was coming down fast,” Farstad said. But the ability to increase capacity quickly — Farstad said that within 45 seconds, the stadium was able to provision new bandwidth, a task that in other situations could take weeks — the Wi-Fi survived the unexpected demands, proof that it should be able to handle whatever happens on Super Bowl Sunday.

“I think we can handle the Super Bowl traffic,” Farstad said.

Verizon: U.S. Bank Stadium DAS already seeing more traffic than Super Bowl 51

A new Verizon DAS antenna handrail enclosure (right) at U.S. Bank Stadium in Minneapolis. (The enclosure lower left is for Wi-Fi). Credit all photos: Paul Kapustka, MSR (click on any photo for a larger image)

The trend of fans continuing to use more and more wireless data at big sporting events shows no sign of slowing down, especially after Verizon Wireless said that it’s already seeing more cellular traffic at Vikings home games this year than it saw at Super Bowl 51.

Verizon, which built the neutral-host distributed antenna system (DAS) for cellular carriers at U.S. Bank Stadium in Minneapolis, also said it increased the DAS antenna count by 48 percent at the venue this past offseason, in order to better support the expected surge coming at Super Bowl 52 on Feb. 4, 2018. At a press event at the stadium today, Verizon said it now has approximately 1,200 DAS antennas of its own at U.S. Bank Stadium.

“We’re very confident” that both the DAS and Verizon’s networks will be more than ready to handle the Super Bowl when it comes to Minneapolis at the end of this current NFL season, said Diana Scudder, executive director for network assurance at Verizon, in a phone interview earlier this week. Though the stadium opened in 2016 with a fully functional DAS, Scudder said Verizon spent the past offseason adding more capacity for its customers with additional DAS antennas in a variety of deployment methods, including antennas in enclosures both under-seat and in handrails, as well as in pole-mounted deployments along standing-room drink railings in both end zone concourses.

It’s selfie time on the drink-rail concourse area, where a DAS antenna looms on a pole behind

Though Scudder declined to say exactly how many DAS antennas there are in the building, with the new “48 percent” additional antennas Verizon said it now has 100 DAS zones throughout the venue, including the seating bowl, concourses, suites, and outdoor DAS coverage surrounding the stadium. But perhaps the most surprising reveal was that in-stadium DAS traffic at Vikings home games this season have already produced single-game numbers that Scudder said were greater than those seen inside the stadium at Super Bowl 51, held Feb. 5 at NRG Stadium in Houston. Pay attention here, because the italicized distinction is important.

Under-seat, handrail and drink-railing DAS

Given Verizon’s historic coyness on numbers, it’s no surprise that Scudder did not provide an exact number for the Vikings in-stadium DAS traffic that she said surpassed Super Bowl 51’s mark. She also didn’t disclose what the in-stadium only DAS number was for Verizon at NRG Stadium. The only reported Verizon number for DAS traffic at Super Bowl 51, 11 terabytes of traffic, includes data not just from the stadium, but also from macro network connections within a 2-mile radius of the stadium on game day, Scudder said. So far, Verizon hasn’t provided a Vikings regular-season game-day measurement for traffic outside the stadium as well. So if it’s not an apples-to-apples comparison yet, if the in-stadium marks are already higher, the bet is that whatever total number Verizon sees at Super Bowl LII, it will be greater than the 11 TB seen at Super Bowl LI.

It’s also not surprising that the DAS installation at U.S. Bank Stadium is already looking like it will surpass NRG Stadium’s marks, simply because with the advantage of greenfield construction, all networks at U.S. Bank Stadium were designed with some of the latest deployment knowledge available. At NRG Stadium, where networks were added well after construction, Verizon deployed DAS antennas under the concrete floors, an easier deployment method but one that typically produces lower throughput than other methods. And for Super Bowl 50 at Levi’s Stadium in Santa Clara, Calif., Verizon added under-seat DAS antennas in what was believed to be the first such deployment for cellular DAS.

Two DAS antennas hang from a pole above the main concourse

AmpThink, which built the Wi-Fi network in U.S. Bank Stadium relying on handrail-mounted AP enclosures, seems to have played a hand in part of Verizon’s DAS upgrade, as some of the new DAS enclosures seem to mimic the Wi-Fi ones. Scudder did say that Verizon used contractors to assist with the new antenna deployment enclosures and mounts, but did not cite AmpThink by name. The new under-seat DAS deployments and the handrail DAS deployments are Verizon-specific, meaning they are not part of the neutral host DAS that provides service for other cellular carriers.

In addition to overhead DAS antennas mounted pretty much everywhere it would make sense — below overhangs, and even in twin-antenna mounts on poles hanging down over concourse walkways — there are now a series of DAS antennas mounted on poles just above the main-concourse end-zone standing areas, where fans can lean against drink rails while watching the game. In a pregame test on Nov. 19 for a Vikings home game against the Los Angeles Rams, MSR tests saw DAS speeds of 77.35 Mpbs download and 32.40 Mbps upload on one of the end-zone concourse areas.

Even up in the most nosebleed of seats — in U.S. Bank Stadium’s case, section 345, which has seats almost touching the roof in the southwest corner, we got a DAS speedtest on the Verizon network of 60.87 Mbps / 44.22 Mbps, most likely from some antennas we could see mounted just above the seats on ventilation pipes a bit toward the field. And hanging from the middle of U.S. Bank Stadium’s roof are a pair of Matsing Ball antennas, which point down to provide cellular service for media and photographers on the sidelines, as well as for floor seating for concerts and other events.

Demand for bandwidth is ‘insatiable’

According to Scudder, any and all antennas are all needed, both for Vikings home games at the 66,200-seat venue, but also for the Super Bowl, where additional seating will host more fans, media and other attendees for the NFL’s championship game.

“The consumer appetite [for wireless data] is insatiable,” Scudder said, noting that these days Verizon pretty much plans to see double whatever the last Super Bowl saw for each following big game. Verizon’s deployments don’t end at U.S. Bank Stadium’s walls, either. According to Scudder over the past 2 years Verizon engineers have been busy adding capacity all over Minneapolis, including in downtown areas, at the Minneapolis airport, and at the nearby Mall of America.

“We’ve been partnering with the Twin Cities for 2 years now and they are very receptive and want to have the latest technology here,” Scudder said. Scudder also said that all the improvements, in DAS, small cell deployments and macro towers, will remain as permanent solutions, helping keep Minneapolis a Super-connected city even after the big game is over.

DAS antennas hang down from the overhang above a suite area

Even at the highest elevation seats in the venue, DAS coverage is excellent, provided in this case by antennas mounted on the ventilation pipes above (see next photo for close-up)

DAS antennas seen mounted below ventilation pipes


Two ‘Matsing Ball’ antennas hanging from center roof beams (this photo courtesy Verizon)

Under-seat DAS antenna (this photo courtesy Verizon)

Vikings testing in-seat beverage delivery via app at U.S. Bank Stadium

A runner delivers drinks to fans at U.S. Bank Stadium. Credit: Minnesota Vikings (click on any photo for a larger image)

The Minnesota Vikings are currently offering in-seat delivery of beverages ordered through the stadium mobile app, a beta test of sorts that may lead to expanded app-delivery options at U.S. Bank Stadium in the near future.

While it’s just a small pilot operation now, available to approximately 8,000 seats in the venue’s east end zone area, any such service takes on greater importance due to the fact that U.S. Bank Stadium is set to host Super Bowl 52 on Feb. 4, 2018. And whether or not the delivery service is available during the Super Bowl, Vikings representatives see it as an important opportunity to see if such services are helpful, profitable and scalable for different areas of the 66,200-seat facility.

“We want to ensure that the user experience [with the deliveries] is good,” said Scott Kegley, the Vikings’ executive director of digital media and innovation, about the go-slow approach. “We want to know all the data pieces, to see if the [current] test can be replicated.”

The Vikings’ small sample size is almost completely opposite of the path taken by the San Francisco 49ers when they opened Levi’s Stadium in 2014. The Niners and their app partner, VenueNext, offered full food and beverage delivery to any seat in the stadium, a service that was recently discontinued. Kegley, who had worked with the Niners during the Levi’s opening, said the Vikings (who also use VenueNext for the stadium app) learned a lot from the Niners’ delivery experiences, such as why just beverages may be a better delivery option than a full menu.

A runner gets ready to deliver drinks. Credit: Minnesota Vikings

Just drinks a lot easier to deliver

Rich Wang, director of analytics and fan engagement for the Vikings, said the Niners’ data showed that approximately 70 percent of all their delivery orders were beverage-only. With space at a premium inside U.S. Bank Stadium, the ability to have runner areas or delivery operations inside the current concession stands was not an option, Wang said. However, by moving some beverage coolers behind a temporary screen, the Vikings were able to create a mini-beverage delivery operations area that could serve a targeted seating area — in this case the 100- and 200-level seats surrounding the east end zone.

After some spot tests of the system last season, this year the Vikings rolled out the east end zone service as an ongoing feature, with delivery of a limited menu of beer, soda and water options. The promotion of the service has been purposely low-key, since as Wang said, the Vikings really don’t want everyone else in the stadium to know the service is available but not to them. Mainly, fans find out about the service through hard-copy promotional material placed in the cupholders, as well as via the app, which makes the delivery service available when fans log in with seat numbers in the service area.

An overhead look at the coolers and runner pickup area in U.S. Bank Stadium. Credit: Paul Kapustka, MSR

Mobile Sports Report was able to view the delivery operation live at the Nov. 19 home game against the Los Angeles Rams, and early in the first quarter it was a busy place, with runners filling orders every time they came back to the small space (a cordoned-off area next to a concession stand and a building entrance). Runners each had insulated bags to carry drinks, and each drink came with a Vikings “Skol” koozie to help keep beverages cold.

According to Wang, the Vikings saw 185 deliveries through the service on Sunday, with half of those orders being for Coors Light, another 25 percent for other alcoholic beverages (Blue Moon and Redd’s ales) and the rest for sodas and water. Unlike Levi’s Stadium, which charged a flat $5 fee for all deliveries, the Vikings instead just add a 15 percent surcharge per product over what fans would pay at a concession stand.

Express pickup and more spaces for delivery

The Vikings also have two concession-stand areas for express pickup orders, one on the main concourse and one on the upper deck. Like the in-seat delivery service, the express pickup areas are another test, to gain data on how fans use the service before attempting expanded offerings. The Niners, which had offered full-stadium express pickup when Levi’s Stadium opened, no longer support the service.

A look at part of the promotional material placed in cupholders in the service area

Should the east end zone test show promise, Kegley and Wang have their eyes on the opposite end zone, where a small unused space exists directly under the lower-level west stands. Backing up to a large concession stand, it looks like a prime area to set up another delivery operation, with the added bonus of having runners walking up to fans instead of from behind, which Wang said would make for easier identification by fans of incoming deliveries. Wang said one of the stats the Vikings are paying attention to is delivery time and steps taken by runners, using a step-tracking app “to make sure the runners aren’t doing half-marathons” during a game, Wang said.

Right now, nobody at the Vikings is saying anything about Super Bowl operations, which are primarily decided upon by the NFL itself. For Super Bowl 50 at Levi’s Stadium, the NFL nixed full-menu deliveries, only allowing beverages to be delivered inside the stadium. Fans did respond positively, however, with a record number of deliveries, so the NFL may look on such a service at U.S. Bank with favorable eyes.

On the Vikings’ end, the service is already producing interesting data, including the fact that 60 percent of people using the service had never before used the team app; and the other 40 percent are now using the app more, according to Wang.

“We’re driving people to download the app, or use it more,” said Wang of the delivery service. Whether or not it will catch on depends on whether or not fans see it as a worthy alternative to just going to a concession stand. But, as Wang said, “nobody wants to wait in lines!”

A runner delivers drinks to fans in the east end zone. Credit: Minnesota Vikings

A look at the lower-level concourse express pickup area. Credit: Paul Kapustka, MSR

Super Bowl LI Wi-Fi sees drop in average per-fan use total

Under seat Wi-Fi APs visible down seating row at NRG Stadium. Credit: 5 Bars

Under seat Wi-Fi APs visible down seating row at NRG Stadium. Credit: 5 Bars

While Super Bowl LI in Houston set records for most total Wi-Fi used in a single day event, the actual amount of average Wi-Fi data used per connected fan actually dropped from the previous year’s game, from about 370 megabytes per user at Super Bowl 50 to about 333 MB per user for Super Bowl 51.

Using official totals provided by the NFL’s official analytics provider, Extreme Networks, there was a total of 11.8 TB of data used on the Wi-Fi network at NRG Stadium in Houston during Super Bowl 51, compared to 10.1 TB used during Super Bowl 50 at Levi’s Stadium in Santa Clara, Calif.

While the total Wi-Fi data number represents approximately a 17 percent increase from Super Bowl 50 to Super Bowl 51, the most recent game had 35,430 users who connected at least once to the network, an almost 30 percent leap from Super Bowl 50’s 27,316 unique users. So while Super Bowl 51 had more unique users (and more peak concurrent users as well) and a higher data total, the average amount of data used per connected fan decreased, from about 370 MB per user to about 333 MB per user.

Data for Super Bowls in years past is thin (mainly because stadium Wi-Fi didn’t really exist), but it’s certainly the first time in very recent history that the per-user average has dropped from one Super Bowl to the next. Super Bowl 49, held at the University of Phoenix Stadium in Glendale, Ariz., saw a total of 6.23 TB of Wi-Fi used, with 25,936 unique users, for a per-user average total of 240 MB. We don’t have any stats for unique users at Super Bowl XLVIII in MetLife Stadium, but with the total Wi-Fi used there at 3.2 TB the average was also presumably much lower as well, unless there were also 50 percent fewer connected users.

Did autoconnect drop the average?

Wi-Fi gear visible above concourse kiosk at NRG Stadium. Credit: 5 Bars

Wi-Fi gear visible above concourse kiosk at NRG Stadium. Credit: 5 Bars

The drop in per-user average data for Wi-Fi is curious when compared to the huge leap in overall DAS stats for the last two Super Bowls, with Super Bowl 51 checking in at 25.8 TB of data, a figure that does not include statistics from T-Mobile, which is declining to report its data total from the game. At Super Bowl 50, all four top wireless carriers combined saw 15.9 TB, so the total for Super Bowl 51 is about 62 percent higher — and if you add in the estimated 3-4 TB that was likely recorded by T-Mobile, that leap is even bigger.

Unfortunately cellular carriers do not provide the exact number of connected users, so there is no per-user average data total available. It would be interesting to know if the expanded DAS preparations made at Super Bowl 50 and at Super Bowl 51 actually connected more total users, or allowed users to use more data per user. We have a request with Verizon for more stats, but it may be a long wait.

One theory we have here at MSR is that it’s possible that a large number of autoconnected devices may have increased the unique-user total while not necessarily adding to the overall Wi-Fi data-used total. In our reporting about the NRG Stadium network we noted that Verizon, which helped pay for the Wi-Fi deployment, had reserved 40 percent of the Wi-Fi capacity for its customers, many of whom could have been autoconnected to the network even without them knowing. We have asked both Extreme and Verizon for a breakdown on Verizon users vs. other wireless customer users on the Wi-Fi network, but have not yet received a response.

https://duwit.ukdw.ac.id/document/pengadaan/slot777/

https://mtsnupakis.sch.id/wp-content/zeusslot/

https://insankamilsidoarjo.sch.id/wp-content/slot-zeus/

https://smpbhayangkari1sby.sch.id/wp-content/slot-zeus/

https://alhikamsurabaya.sch.id/wp-content/slot-thailand/

https://mtsnupakis.sch.id/wp-content/bonus-new-member/

https://smptagsby.sch.id/wp-content/slot-bet-200/

https://lookahindonesia.com/wp-content/bonus-new-member/

https://ponpesalkhairattanjungselor.sch.id/wp-content/mahjong-slot/

https://mtsnupakis.sch.id/wp-content/slot777/

https://sdlabum.sch.id/wp-content/slot777/

https://sdlabumblitar.sch.id/wp-content/bonus-new-member/

https://sdlabumblitar.sch.id/wp-content/spaceman/

https://paudlabumblitar.sch.id/wp-content/spaceman/