AT&T: Hawks, Warriors fans are tops when it comes to DAS data use during championship series

Though we didn’t get a game-by-game breakdown, according to our friends at AT&T the fans for the Stanley Cup Champion Chicago Blackhawks and the NBA Finals Champion Golden State Warriors are also the respective “winners” in their sports for having finals-series games with the most DAS data use.

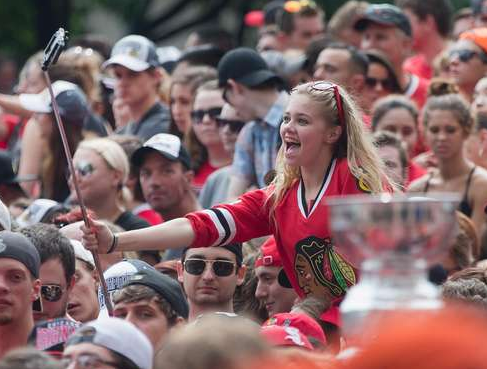
In a blog post outlining some stats for data usage on AT&T networks on distributed antenna systems (DAS) inside the championship venues, the Chicago fans filling United Center had the single highest DAS total for any game in either sport, with 386 gigabytes crossing the network during the Cup-clinching Game 6 on June 15. Warriors fans captured the highest AT&T DAS total for the NBA Finals with a 249 GB mark on June 7 at Oracle Arena, the Game 2 overtime loss to the Cleveland Cavaliers. Remember, these totals are only for AT&T customers on AT&T networks at those arenas. (Any other carriers who want to report results, you know where to find us!)

We are working to get Wi-Fi totals as well since we know all four venues — Chicago’s United Center, Oakland’s Oracle Arena, Cleveland’s Quicken Loans Arena and Tampa’s Amelie Arena all have Wi-Fi, courtesy of our recent HOOPS AND HOCKEY ISSUE. Now all we need are some final stats, so if the folks at each arena are done celebrating or weeping, send your finals Wi-Fi stats our way.

And… THREE! 🙂

Screen Shot 2015-06-22 at 8.34.33 PM

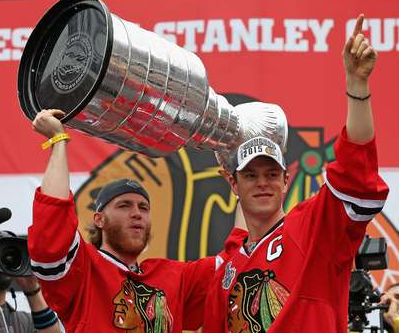
(photos credit Chicago Blackhawks team site)

AT&T: Hoops fans use more data than hockey fans

In a somewhat-not-surprising statistical revelation, AT&T said that basketball fans used more wireless data on its network than hockey fans at the respective arenas during both leagues’ recent championship series.

Using measurements of only AT&T customer traffic from the AT&T digital antenna system (DAS) deployments in arenas in Miami, San Antonio, Los Angeles and New York, AT&T said that hoops fans at the NBA Finals had both higher average data consumption rates and peak data rates than their NHL-watching counterparts. And when it came to home-fan data use, Miami’s American Airlines Arena hit the highest mark, with an average of 177 gigabytes of data used at the two games played in South Beach.

Though the San Antonio Spurs won the NBA title, fans at AT&T Center in Texas used an average of 138 GB of data. Miami’s arena also generated the highest peak data total of 223 GB of data. Of course maybe most of that was Miami fans using OpenTable to make early dinner reservations as the Spurs started blowing the Heat off the court.

On the frozen side of things, Los Angeles won both the real title and the data title, with fans in the Staples Center using an average of 98 GB of data during the three games there during the Stanley Cup Final. The average data usage in New York at Madison Square Garden was 83 GB of data on the AT&T network.

In defense of hockey fans, it’s really no surprise that they used less data since hockey games, especially playoff games, are mostly action and excitement, and not a million time outs. Plus, we all know that had the Chicago Blackhawks been rightfully in the Final to defend their title from last year, Da Hawks fans would have pushed everyone to shame with video renditions of the Chelsea Dagger. Next year.

NBA Fans Leap onto Digital Bandwagon with Soaring Viewership

nba

As we mentioned a few weeks ago the NBA has moved to provide access to its playoffs to a wide variety of platforms including iOS mobile devices, PCs and Kindles. The results are now in and it has resulted in record setting traffic.

The push was done by NBA Digital, a group that is jointly managed by the league and Turner Sports and resulted in the just concluded NBA Championship series having an all time cross platform consumption for the league across its properties that include NBA TV, NBA.com, NBA LEAGUE PASS, NBA LEAGUE PASS Broadband, NBA Mobile, NBADLEAGUE.com, and WNBA.com.
.
The NBA Mobile had huge increases in page views and video streams with more than 138 million page views, up 91% vs. 2012. There were a total of 4.5 million video streams during the 2013 NBA Finals, which represented a 126% increase over last year. The mobile app that is published by the league, NBA Game Time, had a 110% download increase compared to last years’ finals numbers.

NBA TV’s NBA GameTime experienced all time viewership as well with an average of 128,000 total viewers for both shows, numbers that represent a 28% increase compared with last year.

Hopefully this is a trend for the future among all sports. MLB has embraced mobile access for years while the NFL seems stuck with an older, much less encompassing model. As users continue to cut off cable and broadcast television and rely on Amazon Prime, Netflix and others for much of their viewing options, new methods to gram fans will be needed in the future.

https://duwit.ukdw.ac.id/document/pengadaan/slot777/

https://mtsnupakis.sch.id/wp-content/zeusslot/

https://insankamilsidoarjo.sch.id/wp-content/slot-zeus/

https://smpbhayangkari1sby.sch.id/wp-content/slot-zeus/

https://alhikamsurabaya.sch.id/wp-content/slot-thailand/

https://mtsnupakis.sch.id/wp-content/bonus-new-member/

https://smptagsby.sch.id/wp-content/slot-bet-200/

https://lookahindonesia.com/wp-content/bonus-new-member/

https://ponpesalkhairattanjungselor.sch.id/wp-content/mahjong-slot/

https://mtsnupakis.sch.id/wp-content/slot777/

https://sdlabum.sch.id/wp-content/slot777/

https://sdlabumblitar.sch.id/wp-content/bonus-new-member/

https://sdlabumblitar.sch.id/wp-content/spaceman/

https://paudlabumblitar.sch.id/wp-content/spaceman/