Stadium Tech Report: Sharks bite into digital future with new Wi-Fi, app strategy for SAP Center

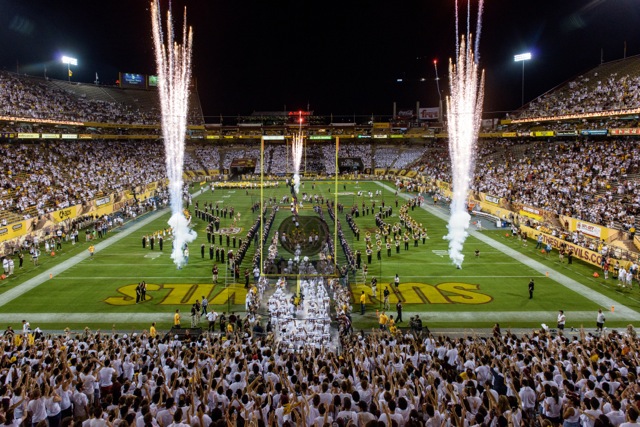
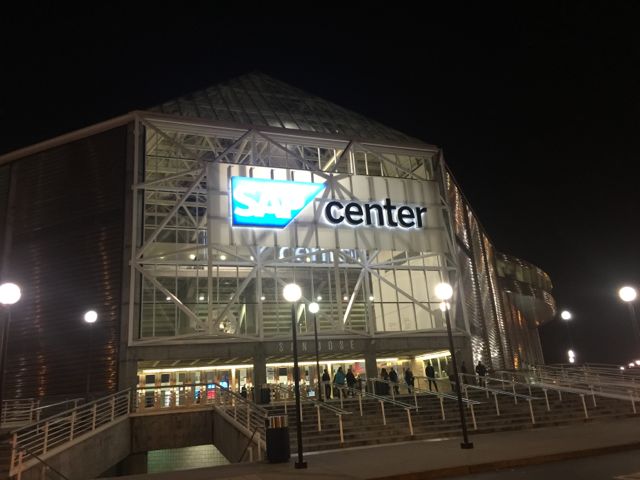
Welcome to the Shark Tank. Credit: Paul Kapustka, MSR (click on any photo for a larger image)

Here’s a dirty secret about Silicon Valley sports: Even in this birthplace of the digital era, the hometown hockey arena has historically had some of the worst mobile connectivity around.

Despite the fact that loyal hockey fans always faithfully filled the seats to support their San Jose Sharks, the building now known as the SAP Center somehow never had the kind of wireless network you’d think its tech-savvy locals would demand.

But that was then. This is now.

After years of low connectivity, the “Shark Tank” is now filled with speedy, high-definition Wi-Fi that forms the base of a new digital-experience strategy for the Sharks and the SAP Center. The new digital experience includes a new team app as well as multiple LED screens in all parts of the stadium, bringing the old building screaming into the forefront of older venues retrofitted with technology that both enhances the fan experience while providing new business opportunities.

“If sports is behind the world in technology, we were even behind in sports,” said John Tortora, chief operating officer for the San Jose Sharks, about the building’s historical shortcomings. Interviewed between periods during a late-January visit by Mobile Sports Report to a Sharks game at SAP Center, Tortora said a sort of perfect storm of desires and needs arrived this past postseason, ending up as an initiative that brought in the arena’s first true fan-facing Wi-Fi network, an expanded LED-screen deployment throughout the arena and a new stadium app. Together, the elements are all aimed at supporting a data-driven strategy to improve marketing efforts while simultaneously providing a huge boost to the fan experience.

And make no mistake about it, better connectivity was an amenity fans wanted most of all.

High-density Wi-Fi provides digital backbone

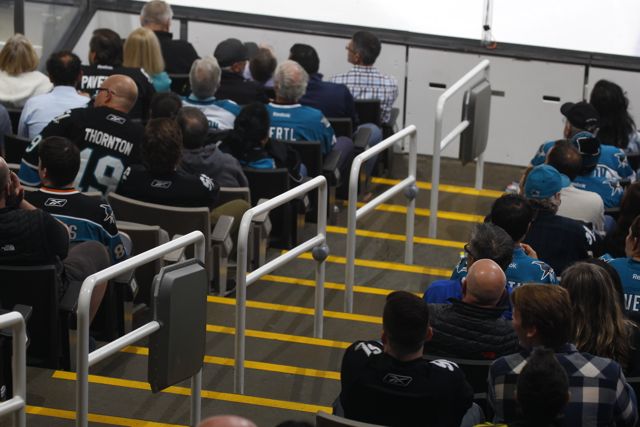
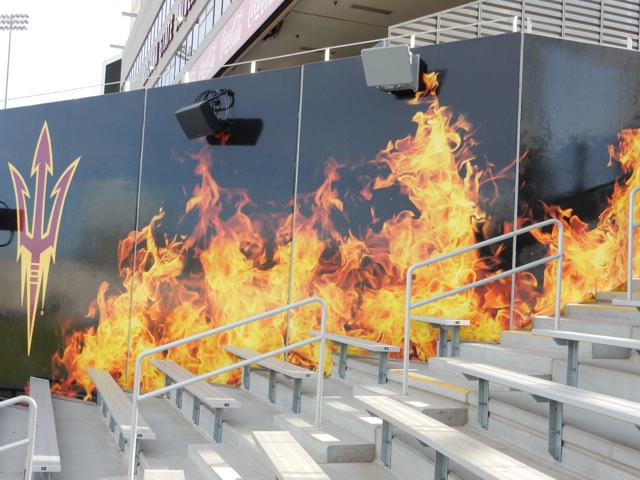
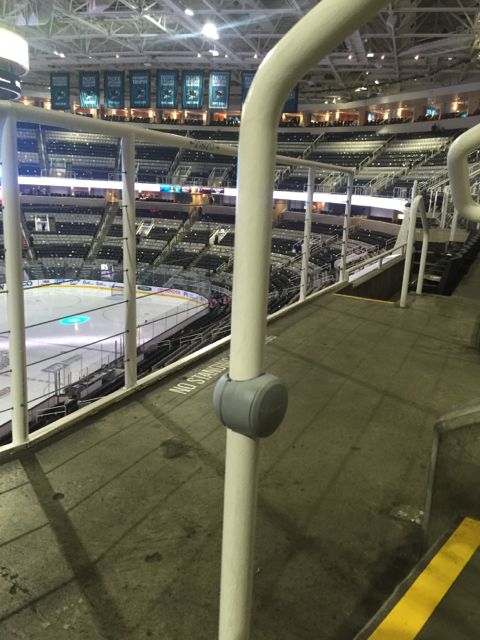
Handrail enclosures bring Wi-Fi APs close to the fans. Credit: San Jose Sharks

Editor’s note: this profile is from our most recent STADIUM TECH REPORT, which also has in-depth looks at new networks at the Utah Jazz’s Vivint Smart Home Arena, and a recap of wireless activity from Super Bowl LI! DOWNLOAD your FREE COPY today!

“We had a survey of fans from the first half of last season, and the direct response was that the Wi-Fi needed to be improved,” Tortora said. Though there was some Wi-Fi in the building — according to Tortora, there was a system deployed in 2013 — it wasn’t anything the team wanted to talk about or promote; in fact, multiple requests by MSR to review the stadium’s networking infrastructure went ignored for years, prior to the new initiative now in place.

According to Tortora, there were also previously a number of different standalone apps for the various activities that took place in the building, including separate ones for the Sharks, the seasonal Disney ice shows, for youth hockey programs and for other SAP Center events like concerts. Bringing multiple apps together into a unified strategy led the Sharks to simultaneously seek a partner to help upgrade the mobile network infrastructure. Tortora said the Sharks found that partner in Cisco, which brought Wi-Fi gear and its StadiumVision digital-display system as well as some creative financing to the table.

“We had a chance to parallel both a new app and a new infrastructure, and Cisco was a great partner,” Tortora said. Though the terms are undisclosed, Cisco is also participating in the financing and operation of the network marketing elements as a partner to the Sharks.

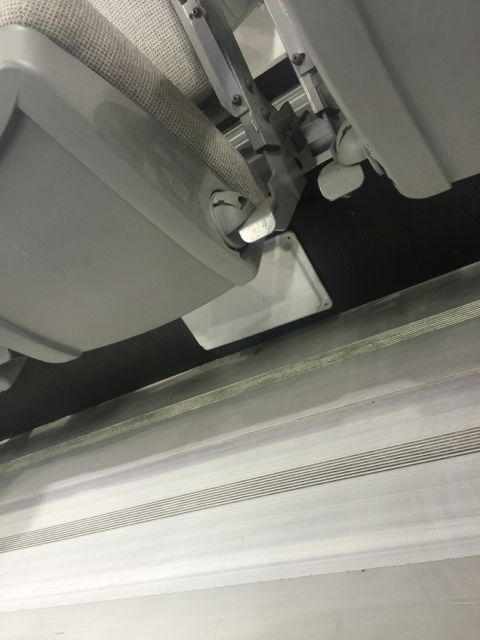
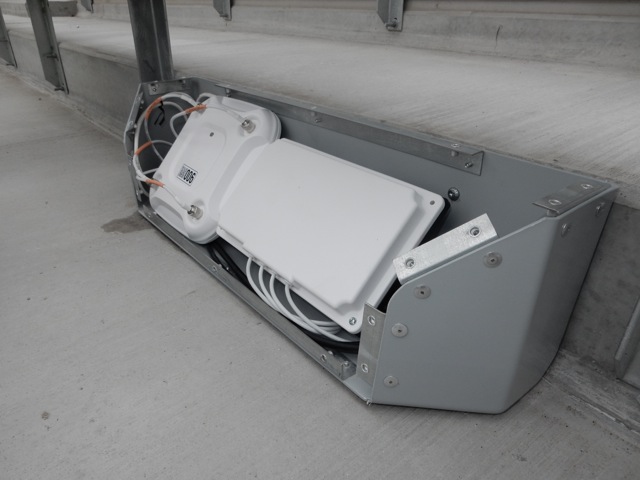
Under-seat AP enclosure in the lower bowl. Credit: Paul Kapustka, MSR

The Sharks also brought in Wi-Fi deployment expert firm AmpThink to lead the network design, and used Daktronics technology for the multiple new LED boards, many of which are located in the previously blank-walled concourse and club areas. The result is a high-density Wi-Fi network operating at peak speeds, which forms the base for a high-touch digital experience that will ultimately give the Sharks deeper insight into fan behaviors, and a more personal way to deliver the right experience to each fan walking through the doors.

Going low and high to deliver Wi-Fi

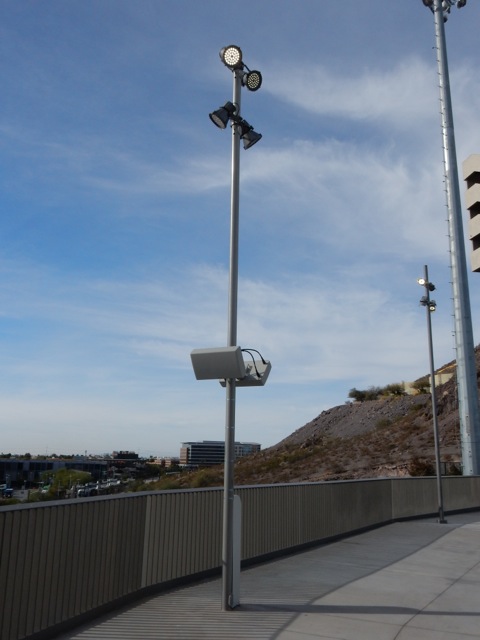
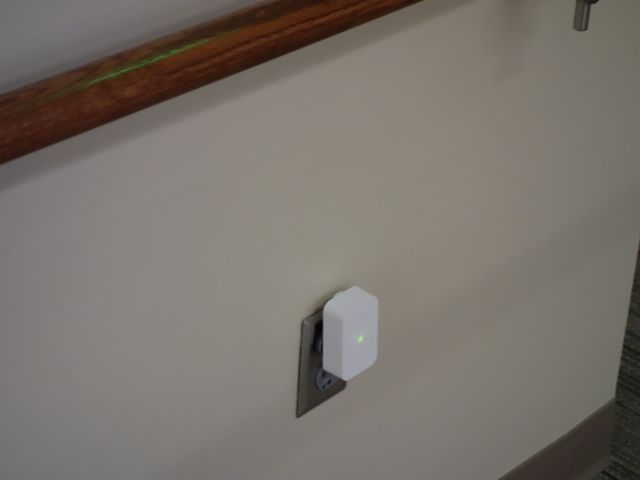
Even before you get inside the building, you can connect to the new SAP Center Wi-Fi network, thanks to a bank of APs mounted on the outside walls. Allison Aiello, director of information technologies for the Sharks, said that many fans typically gather just outside the arena pregame, especially in a park just to the east side, and with the push toward more digital ticketing, providing pre-entry connectivity was a must.

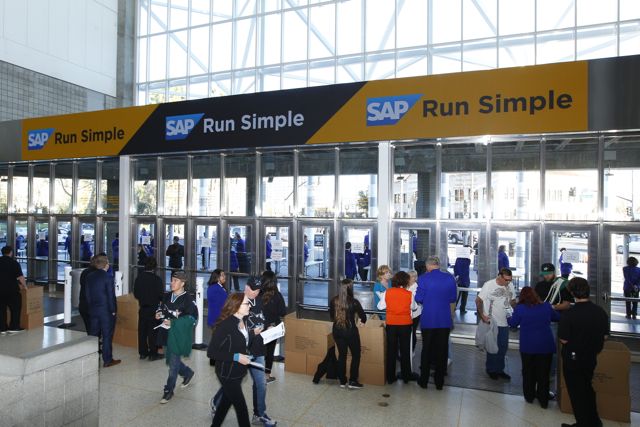
Once inside the doors, fans are greeted by the innovative “Kezar” scanners from app developer VenueNext, which can scan either paper or digital tickets, with a green light on the top of the cylindrical system showing that a ticket is valid. Connectivity inside the entryways is also superb, as our tests showed Wi-Fi download speeds in the mid-60 Mbps range, even as crowds of fans came in through the doors.

Wi-Fi APs hanging from the rafters. Credit: Paul Kapustka, MSR

A quick lower-level visit to the main data room showed some of the challenges of retrofitting an older building (the arena, which opened in 1993, had been known as the Compaq Center and the HP Pavilion before becoming the SAP Center in 2013): One of the members of our tech-tour entourage bumped his head on a low-hanging pipe, part of the ice-making infrastructure, on the way to the data center doorway.

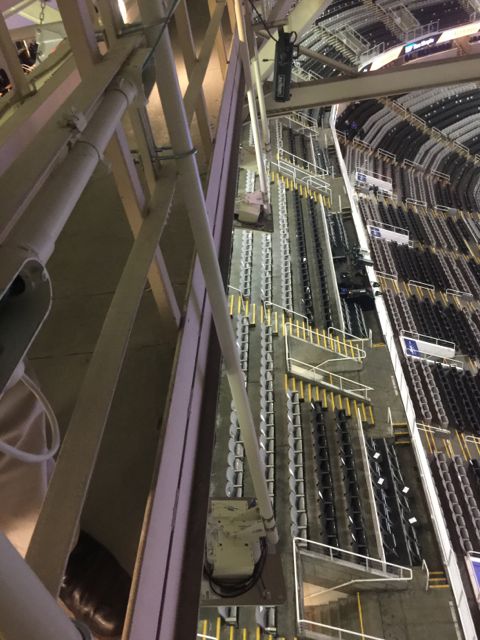
With more than 20 years of cabling history inside its walls, the SAP Center wiring closets were an ongoing challenge for the implementation crew from AmpThink, which took pride in its work to streamline and organize the wiring as it installed the new network (with some of the cabling in new, Shark-specific teal coloring). Moving out into the lower seating bowl, AmpThink president Bill Anderson showed off some of the under-seat and railing-mounted AP enclosures, where attention to detail includes drilling concrete cores around the railings below the surface level so that shoes, brooms and other items don’t catch on areas where work has been done.

Anderson said the lower-bowl network is only operating on 5 GHz Wi-Fi channels, adding San Jose to an industry trend of leaving 2.4 GHz channels off the network in fan-facing areas. The main reason for this switch has to do with both the administrative challenges of the 2.4 GHz networks, along with the fact that almost all consumer devices these days support the wider bands of the 5 GHz space. Anderson also had high praise for Cisco’s new 3800 series of Wi-Fi APs that were used in the deployment, which can support dual 5 GHz channels.

According to the Sharks’ Aiello, there are 49 handrail Wi-Fi enclosures in the lower seating bowl, with 47 of those having two APs in each enclosure. For concerts, she said the arena can hang additional APs over the sideline hockey boards, which stay in place while the end zone boards are removed. The total number of APs in the stadium is 462. Our pregame network tests prior to a Sharks-Blackhawks game on Jan. 31 showed a Wi-Fi speed of 63.39 Mbps download and 57.59 upload, halfway down the stairs between sections 114 and 115.

Overhead Wi-Fi for the upper deck

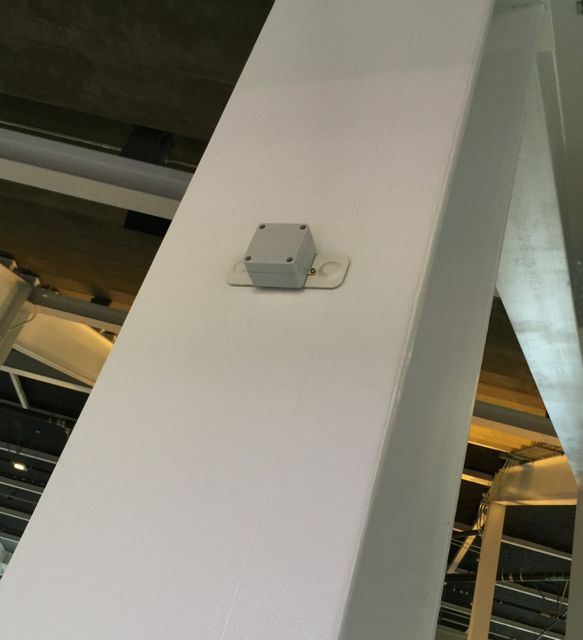
In stadiums where under-seat or handrail APs are used, it’s usually best to not combine those placements with overhead APs since client devices will often seek to connect first to overhead APs, even if they are farther away. But due to a quirk in the SAP Center’s construction, AmpThink went with a deployment strategy of overhead APs for the arena’s upper seating deck, mainly because of the low ceiling that is closer to the seats than many other indoor venues.

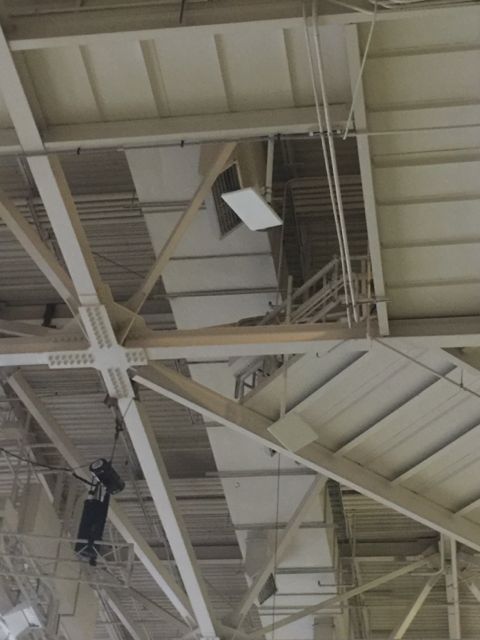
A look at the overhead APs from below. Credit: Paul Kapustka, MSR

Though combining different AP architectures is tricky, AmpThink’s Anderson said it’s better to pick “the one that’s economically right” rather than staying stuck with one method. Overhead placements like SAP Center’s, which are hung from the walkways near the roof, are typically much cheaper per placement than under-seat or handrail deployments, which often require extensive work including core drilling through concrete floors.

“I was a little concerned at first [about the combination of overhead and railing placements] but the roof is close enough to work,” said Aiello of the dual placement methods. According to AmpThink’s Anderson, most of the overhead antennas are about 30 feet away from the seats, with the farthest being 45 feet away — still close enough so that the power needed to reach fans doesn’t bleed the signal down into the lower bowl. Aiello also noted that an under-seat or handrail AP design for the upper deck would have required the Sharks the extra expense and work to drill through the ceilings of the stadium’s premium suites, which are located between the two main bowl seating levels.

In the upper deck section 219, we tested the Wi-Fi at several seating locations and came up with consistently fast speeds, including one at 48.88 Mbps/44.96; at the lounge area along the arena’s top row we saw even faster speeds, including a mark of 68.00/68.52. We also saw many VenueNext railing-mounted beacon enclosures, part of a planned 500-beacon network that Aiello said will be coming online sometime soon.

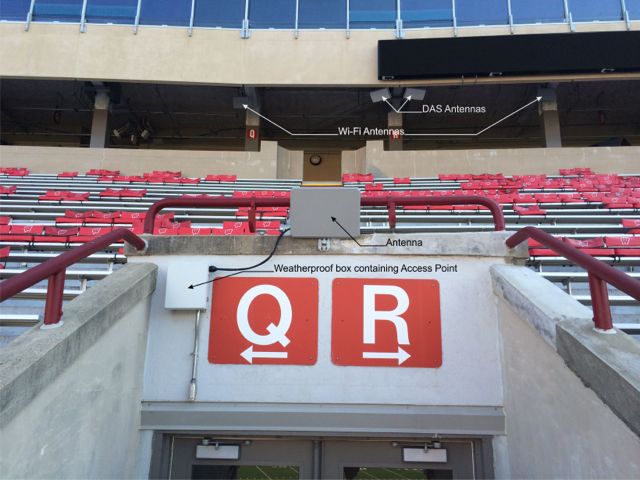
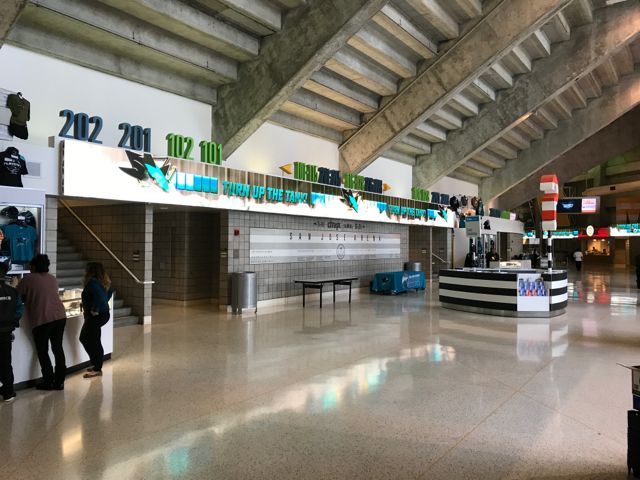
Since hockey games have two long breaks built into each game, it’s extremely important for venues to provide good connectivity in concourse and club areas where fans typically congregate between periods. And even though the SAP Center is an older building — which sometimes makes aesthetics a challenge — AmpThink and the Sharks were able to hide almost all of the APs that are placed every 50 feet around the main circular concourse thanks to a small drywall facade that sticks out from the main wall to support directional and section-number signage.

While some of the Wi-Fi speedtests we took while roaming the concourse during the crowded pre-game were in the high 40 Mbps range, we also got a few tests much higher, with one at 67.94 Mbps/ 58.14 Mbps, and another at 63.76 / 55.96, the latter near a crowded concession area. And even with fans streaming in at a good clip, we even got one test at 69.62 / 70.54 near a doorway, showing that walk-around coverage appears to be solid throughout the building.

A VenueNext beacon mount in the upper deck. Credit: Paul Kapustka, MSR

And even though the Sharks were eliminated in the first round of this year’s playoffs, fans used the SAP Center Wi-Fi at higher levels than normal during the postseason. According to Aiello, the stadium saw a peak of 5,013 concurrent users en route to a total of 1.3 terabytes of data used at the first home playoff game; the second home game saw 1.1 TB of data used, with 4,890 peak concurrent users.

New LED boards keep fans connected while out of seats

If the Wi-Fi APs will remain hidden to fans strolling the concourses, the new LED boards will have an opposite effect — instead of just a few TV screens here and there, the Sharks and Daktronics, along with AmpThink and Cisco have gone all-in with a strategy that has multiple-screen boards and long banks of LED strips that can all be controlled and programmed from a single location, thanks to the Cisco StadiumVision system.

Having networked and controllable screens is a huge plus for administration — according to Aiello the previous setup required manual walk-arounds to configure and check each display. AmpThink also helped reduce the wiring needed for all the new displays by connecting the LED boards to the IP cabling used for the Wi-Fi system.

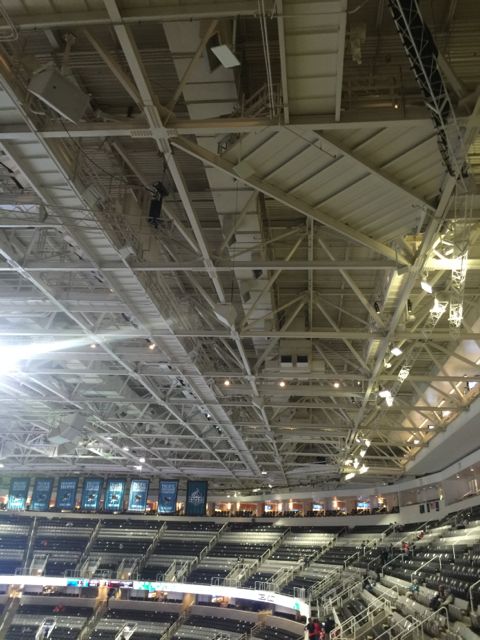
This photo shows how close the ceiling is to the upper deck seats. Credit: Paul Kapustka, MSR

“The video, audio and Wi-Fi all used to be discrete systems,” said AmpThink’s Anderson. “Now they all roll up to one converged network.”

With StadiumVision, the Sharks will be able to program the displays on the fly, substituting advertising for live game action as quickly as hockey teams change players on the ice. Aiello noted that the combination of screens and a beacon system will allow the Sharks to sell more targeted advertising with real metrics showing the number of fans in the area of a display. Big displays mounted above doorways can also be changed to assist with foot traffic and transportation info for postgame exit flows.

App already providing more marketing leads

Wrapping it all together in the fans’ hands is the new app from VenueNext, a company Tortora said the Sharks had been in contact with since its inaugural launch of the Levi’s Stadium app for the San Francisco 49ers. While the VenueNext app will evolve over time to potentially add in a list of services, the ability to let fans move tickets around digitally has already helped the Sharks start down their desired path of having more personalized information to better reach current and prospective customers.

“During the preseason this year we had 2,500 tickets transferred per game, versus 800 during last year’s preseason games,” Tortora said. Because many of those transfers involved sending tickets to email addresses or phone numbers that weren’t current season ticketholders, Tortora said the Sharks were able to add approximately 7,500 new names to their ticket marketing database, which Tortora simply called “gold.”

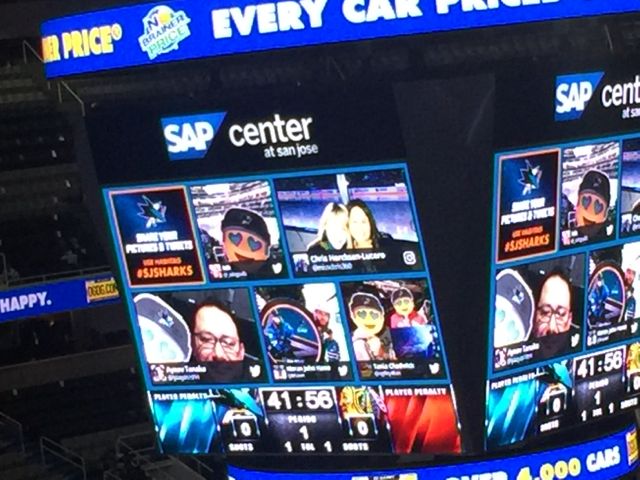
Fans’ social media posts are featured on the scoreboard during pregame. Credit: Paul Kapustka, MSR

“To do digital tickets, fans have to download the app, so now we can market directly to that person,” Tortora said. That move will help the Sharks identify things like “who’s not coming to games and why,” which may help the team find out early if fans may not be wanting to renew season tickets, and market to them accordingly.

A Cisco-built fan portal is also part of the overall package, and eventually the team hopes to use that software to construct more-personal marketing messages that can be determined by factors including live presence and location within the building. As more data accumulates, Tortora said the Sharks plan to get even deeper into a strategy currently underway that revolves around dynamic ticket pricing.

“We can use data to find out where seats are in demand, and where some sections may not be selling well,” Tortora said, and shift prices accordingly. The team has already broken seating prices into 16 different categories for this season, with plans to expand that to 36 different categories for next season, Tortora said.

“Airlines do this, hotels do this,” Tortora said. “It’s all about being data-driven.”

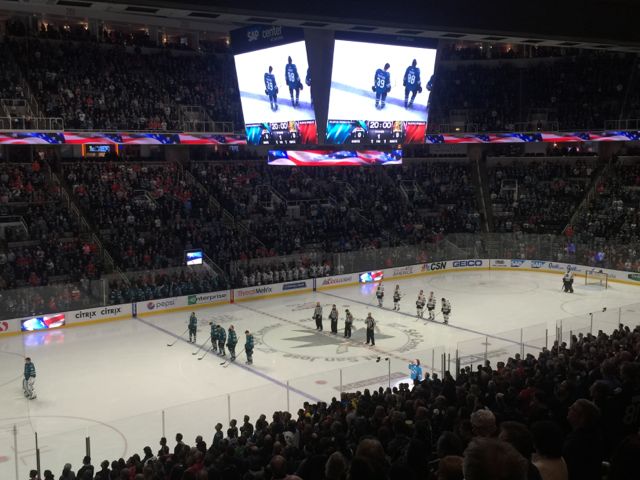
The Sharks and Blackhawks get ready to rumble. Credit: Paul Kapustka, MSR

LED screens above an entryway. Credit: Paul Kapustka, MSR

More LED screens above the seating entry areas in the main concourse. Credit: San Jose Sharks

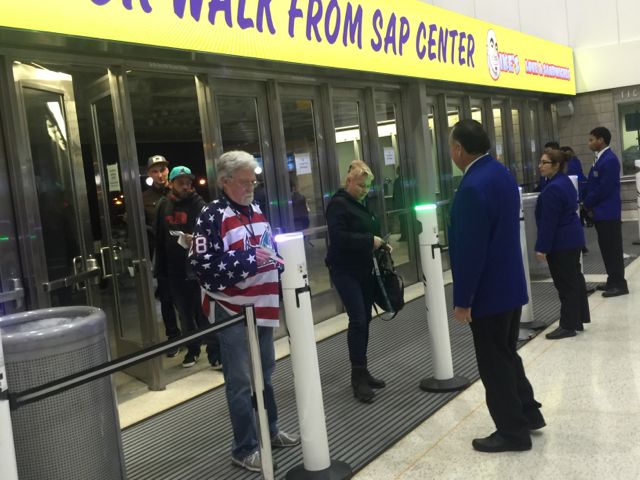
LED screens above entryway, where fans use the VenueNext ‘Kezar’ scanners to validate tickets. Credit: Paul Kapustka, MSR

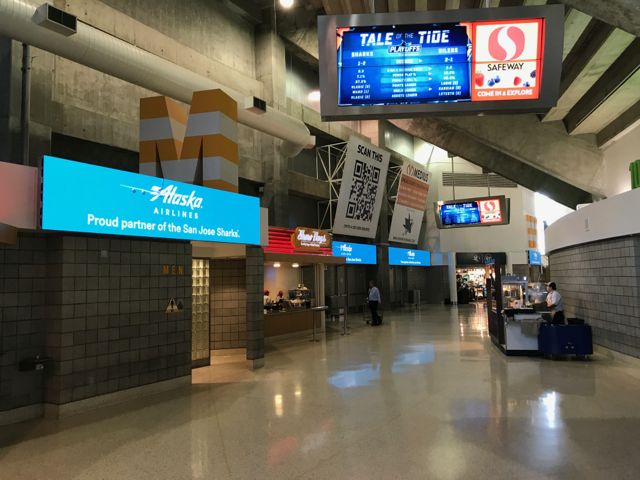
Even more LED screens, on a different concourse. Credit: San Jose Sharks

Arizona State upgrades DAS, Wi-Fi at Sun Devil Stadium

Sun Devil Stadium at Arizona State. Credit all photos: ASU

Sun Devil Stadium at Arizona State. Credit all photos: ASU

When Arizona State University started renovating Sun Devil Stadium three years ago, the project wasn’t so much a simple wireless refresh as it was a total reset of what technology, sports and academia could co-create.

In addition to expanded Wi-Fi and DAS for the stadium (a venue that includes classrooms, meeting rooms and retail outlets), ASU activated a virtual beacon trial. The university also joined up with Intel to explore how Internet of Things devices might yield better environmental information about the bowl, including acoustic data, Jay Steed, assistant vice president of IT operations, told Mobile Sports Report.

The university’s IT department understood that a richer fan experience for football and other events would require a robust network. Steed and his colleagues visited other venues like Levi’s Stadium, AT&T Stadium, Stanford and Texas A&M to get a better handle on different approaches to networking, applications and services.

Regardless, some sort of refresh was overdue. Wedged between two buttes in the southeastern Phoenix suburb of Tempe, the 71,000-seat Sun Devil Stadium was completed in 1958 and needed infrastructure and technology updates. Wi-Fi access was limited to point-of-sale systems and stadium suites; fans generally relied on a DAS network.

Time for an upgrade

Editor’s note: This profile is from our latest STADIUM TECH REPORT, the ONLY in-depth publication created specifically for the stadium technology professional and the stadium technology marketplace. Read about the Sacramento Kings’ new Golden 1 Center and the new Wi-Fi network for the Super Bowl in our report, which is available now for FREE DOWNLOAD from our site!

“The stadium needed a lot of facelifting, not just from a technology perspective but also for the fan experience, like ADA compliance and overall comfort,” Steed said. “We didn’t just want to rebuild a venue for six football games a year, but extend its availability to 365 days and make it a cornerstone and anchor for the whole campus.”

The 'Inferno' student section got a priority for better connectivity.

The ‘Inferno’ student section got a priority for better connectivity.

The reset included tearing out the lower bowl to “punch some new holes” — new entry points to the stadium — and to add conduits and cabling for the new 10-gigabit fiber backbone for the stadium. The network can be upgraded as needed to 40- and even 100-gigabit pipes, according to Steed.

“We wanted to make sure it could support fans’ [connectivity needs] and all the facility’s operations with regard to video and StadiumVision, learning and education, and Pac-12 needs as well,” he said.

The overall stadium renovation was budgeted at $268 million; the technology upgrades will total about $8 million.

The university added 250 new DAS antennas. The vendor-neutral network includes AT&T, Verizon, Sprint and T-Mobile, which share 21 DAS sectors to keep cell service humming inside the stadium.

On the Wi-Fi side, ASU opted for Cisco’s access points. The networking vendor was already entrenched across the 642-acre campus; Steed and the IT department prefer the simplicity of a single-vendor network. Cisco helped with the hardware and RF engineering for Sun Devil Stadium. CenturyLink offered guidance on the networking and fiber pieces of the project, while Hunt-Sundt, a joint venture, was the contractor for most of the physical construction.

Wireless service for ‘The Inferno’

When the renovation is officially completed later in 2017 (most of the network is already live), there will be 1,100 APs in and around Sun Devil Stadium. The student sections, also known as The Inferno, get more APs and bandwidth since historical data has shown students to be the biggest bandwidth consumers in the stadium. Consequently, the ratio in the student sections is one AP to every 50 users; the rest of the bowl’s APs each handle about 75 users on average, Steed said.

Breakaway look at an under-seat AP

Breakaway look at an under-seat AP

ASU’s new Wi-Fi network was engineered to deliver 1.5 Mbps upstream and 3 Mbps downstream, but Steed said so far users are getting better performance – 8 Mbps up and 12 Mbps down. “We’re getting about 25 percent saturation,” he added. “Many users put their phones away during the games, but we see spikes at halftime and during commercial breaks.” Regardless, ASU continually monitors Wi-Fi and DAS usage and adjusts bandwidth as needed.

Another big challenge is the desert climate – temperatures regularly soar into triple digits. With about 450 under-seat APs in the bowl, Steed and his team had to make sure the enclosures could withstand heat and didn’t obstruct the walkways. “We’ll see how well the electronics do, baking at 120 degrees six months out of the year,” he laughed.

ASU is also working with Intel, using the stadium’s APs as part of an Internet of Things trial. As Steed described it, IoT sensors work alongside stadium APs to measure temperature, noise, vibration and other environmental data. “We also look at lighting control and water distribution and flow,” he said.

Concourses also got expanded Wi-Fi and DAS coverage.

Concourses also got expanded Wi-Fi and DAS coverage.

Automating the control of environmental functions like heating, cooling, power usage and facilities management will help the university toward its goal of being carbon-neutral by 2025, Steed added. The trials are designed so that the technology can be expanded across the university, possibly for campus transportation kiosks or student concierge services. IoT devices could give students and visitors information about adjacent buildings or landmarks around campus.

Separate but related, the university is also testing cloud-based, Bluetooth low energy (BLE) technology from Mist Systems. These “virtual beacons” use sensors attached to an AP to flag information or a point of interest for students or stadium visitors. “The virtualized beacon technology helps us understand where people are walking around and what they’re looking at in the stadium and elsewhere around campus,” Steed said.

They’re currently being tested in some of Sun Devil Stadium’s suites; Steed foresees expanding that to the student union to help guide people to meeting rooms, retail facilities or food vendors, for example.

Steed credited excellent communication and collaboration among the university’s athletic and IT departments and other players in the upgrade equation. “Our athletic director, Ray Anderson, brought the CIO and me into his office and really worked together with us,” he explained. “The biggest piece of our success was knowing that the AD supported our recommendations and brought us in as valued advisors.”

University of Wisconsin takes on Wi-Fi, Badger Game Day app upgrades

Camp Randall Stadium, University of Wisconsin. Photo: Dave Stluka

Camp Randall Stadium, University of Wisconsin. Photo: Dave Stluka

Sports fans at the University of Wisconsin have been enjoying a nice technology two-fer for the last 20 months: In addition to new Wi-Fi and beacon technology at its largest sporting venues in Madison, Wisc., the university also released v3.0.2 of its Badger Game Day app which adds live and archived video, among other features, for fans and their smartphones.

Jim Roberts, director of technical services for the university’s athletic department, described this as a happy coincidence as opposed to a larger strategy to bring sports technology to the Badger faithful. “Knowing that the new Wi-Fi system was coming, the group working on the app upgrade was able to incorporate more features, knowing fans could take advantage of the improved Wi-Fi and not rely solely on cellular data plans,” Roberts said.

Editor’s note: This profile is an excerpt from our latest STADIUM TECHNOLOGY REPORT, which is available for FREE DOWNLOAD from our site. In addition to this stadium tech deployment profiles we also take an in-depth look at the new trend of deploying Wi-Fi and DAS antennas under seats, and provide a wireless recap from Super Bowl 50. GET YOUR COPY today!

The Wisconsin venues are Camp Randall, a bowl-style football stadium with a capacity of 80,321; and nearby Kohl Center, used for hockey, basketball, concerts and other live events with room for 17,230. The LeBahn Arena, built for women’s ice hockey with a capacity of 2,273, is also included. In part because of their proximity, Roberts and his team used the upgrades to replace and enhance the underlying infrastructure for the venues – core switching, Wi-Fi access points, an IPTV system, cabling, electrical power and HVAC improvements — $11 million for the whole package, according to Roberts.

“Due to the expected size of the population connecting to Wi-Fi, we had to upgrade the entire network,” he explained, adding that the previous 10/100 Mbps backbone with Gigabit Ethernet uplinks and its 32,000 MAC address capacity was insufficient for the job.

“We upgraded our core to some pretty big Cisco routers at each venue that could handle 128,000 MAC addresses, with 10-gigabit fiber to all 33 telecom rooms within the Camp Randall complex,” he said; they also added about 1,100 wireless APs. Camp Randall got upgraded during the summer of 2014; the Kohl Center and LeBahn were done a year later.

Kohl Center

Kohl Center

Camp Randall proved to be the largest test, both from an engineering and design perspective. Built in 1917, its open bowl lacks the overhangs from which RF engineers love to hang antennas and other infrastructure.

“The east side of the bowl became our biggest challenge with getting the signal to penetrate deep enough into the sections,” Roberts said, adding that the problem was especially acute for seats closest to the field, where the first few rows are tarped over. Initially, APs were installed below the tarps, but the signal only carried 10 rows back.

“We ended up mounting the APs on the front, 4-6 feet up from ground level,” and above the tarps, he explained. “They don’t affect the sight lines for spectators. But getting the APs to shoulder height from waist height definitely helped us get it back to row 25.”

APs were also mounted just above the entry tunnels, where the hardware and antenna could be attached to railings and concrete. Cisco is the University of Wisconsin’s AP vendor; the deployment uses Cisco model 3700s.

Wi-Fi install over a VOM at Camp Randall (click on photo for a larger image)

Wi-Fi install over a VOM at Camp Randall (click on photo for a larger image)

Roberts and his team also ran into some structural issues with waterproofing and cabling that kept them from putting in more APs in the student section. They had to re-calculate where the APs would go; consequently, coverage can be spotty in the student section, which is exacerbated by the high density of phones in that part of the stadium. AT&T and Verizon both have DAS infrastructure in Camp Randall that helps coverage, but Roberts and his team are looking at long-term solutions for Wi-Fi coverage in that section and throughout Camp Randall.

The University of Wisconsin worked closely with AmpThink on a facility-wide Wi-Fi analysis, according to Bob Lahey, a network engineer in the athletic department. AmpThink did the design and tuning and worked out some issues in advance. “Our facilities staff and [AmpThink] discussed locations for best coverage and worked through the aesthetics before we started the project,” Lahey said. AmpThink was also onsite during the first year to see how the Wi-Fi performed with people in the bowl. “You can only figure out so much without people there,” Lahey laughed.

Getting Online at Camp Randall

The stadium’s fan-facing wireless network, Badger WiFi, is a captive portal that asks users for their name, email address and zip code. There are also two boxes: one, users must check to agree to terms and conditions of service; the second allows the university to send them emails, and by default, the second box is checked. “Our plan is to send them email surveys and allow them to remain on the system and not have to re-authenticate every time they come to one of our buildings,” Lahey said. “But if they uncheck, they have to re-authenticate.”

The university does no bandwidth limiting or throttling back usage once users are logged in. “We’ve got dual 10-gigabit links and 100-gigabit to the world, so we’re not too concerned about overall bandwidth,” Lahey said. “We limit each radio in the AP to a maximum of 200 clients. It doesn’t happen often, but we see it occasionally.” Camp Randall users normally get at least 1 Mbps bandwidth — plenty for checking scores or posting to social media, Lahey added. Kohl Center users average 40-60 Mbps because the venue is less dense.

Screen shot of Wi-Fi portal login

Screen shot of Wi-Fi portal login

At present, 65-70 percent of Badger Wi-Fi clients are on 5 GHz spectrum rather than 2.4 GHz. Roberts finds the 5 GHz band easier to manage, and said users get a better experience. “If we have problems with wireless, it is most times an older couple with their iPhone 4,” Roberts said. “APs can only do so much, but sometimes a phone [using 2.4 GHz spectrum] will want to connect with an AP a half mile across the field rather than one that’s 10 feet away.”

He also said the maximum number of unique clients for Camp Randall is about 26,000, or 37 percent of the crowd. “We assume that’s going to keep growing and we’ll have to augment the system,” he said. “At some point we won’t have enough access points.”

Game Day Gets a Badger Refresh

Concurrently, the Badger Game Day smartphone app was getting new features like live video replay and interaction with Bluetooth-based beacon technology. The app’s first iteration was initially for football, then expanded to all 10 sports that sell tickets; the latest version embraces all 23 sports at the University of Wisconsin, men’s and women’s. “Not many schools have all their sports represented, so while the traffic may not be high on rowing, it’s a great recruitment tool,” said Ben Fraser, director of external engagement for the athletics department. “So it helps there with the coaches sending out links or for parents and other supporters.”

It also helps with fans. “Collegiate and professional sports venues are looking for how to keep fans entertained and also allow them to participate in the game via social media and other methods,” noted Tam Flarup, director of the athletic department’s website services. When there’s break in the action, Badger fans are busy posting to Facebook, Instagram and of course, Wisconsin’s infamous Jump Around. “Twitter’s also allowing Periscope live video in its tweets now,” Flarup added. “Our fans will like that – it keeps them in the stands with a great game day atmosphere and experience.”

The university developed the first two iterations of Badger Game Day internally but chose to outsource the upgrade to sports-app developer YinzCam in June 2015 and gave them a tight deadline to meet — Aug. 30, just in time for Badger football season. YinzCam delivered on time, and then met an Oct. 15 deadline for revisions and tweaks, Fraser said.

Badger Game Day now includes live video replay from four different camera angles; YinzCam’s secret sauce makes streaming video across Wi-Fi more efficient. “Video would have been impossible without the Wi-Fi investment we made,” Fraser said.

Unlike previous iterations that only allowed the participation of a single sponsor, the new Badger Game Day app gives the university the ability to sell individual pages and sports, Fraser said.

Game day beacon message to app

Game day beacon message to app

Perhaps the leading edge of Badger Game Day is its use of Bluetooth-based beacon technology and messaging with geo-fencing. Gimbal Inc. worked with the university customize the technology; Fraser and his team did some social media messaging to alert fans to the feature and to remind them to turn it on.

The first remote use of messaging with beacons and geo-fencing was in Dallas for Wisconsin’s season opener in Dallas at AT&T Stadium; the feature was then used continually at both Camp Randall and the Kohl Center.

“We continued to use this messaging on the road for the Holiday Bowl in San Diego,” Fraser said. “Messages varied from welcome messages that were linked to videos from our players, to informational messages that informed fans about events, to scavenger hunts that engaged our fans at these sites.”

When users first download the app, there’s a proximity allowance message that they must activate to receive beacon messages. So far, the university has sent out 46 unique messages, 21 of which were geo-fenced. At each home game, they geo-fence Camp Randall with a welcome video from players; they reached an average number of 1,160 fans per game with these welcome messages and videos.

“We’re still learning how fans are using [beacons and Bluetooth], and we’re trying not to hit them with too many ads,” Fraser said. By building their trust, it encourages fans to leave their Bluetooth on for the signal to find them. “And we are looking for ways to improve it,” he added. Potential future additions: Features that show the length of lines at concession stands and restrooms, and an online lost and found. They’re also looking for more robust scheduling information inside the app — such as which broadcast network is carrying the game, along with links to Wisconsin’s video stream and live stats.

App development and a new server cost the university about $100,000, according to Fraser and Flarup. Since August 2015, there have been 123,000 downloads of Badger Game Day and nearly 1 million page views. Average time spent per game on the audio feature of the app is about 14 minutes. There’s more room to grow as fans continue to download and use the app; there’s plenty of revenue upside as well as sponsors discover multiple avenues for their messaging and content.

Aruba expands beacon management options, adds VenueNext as app development partner

An Aruba Sensor "in the wild" at the University of Oklahoma library, part of a test deployment of the new hardware. Photo: Aruba (click on any photo for a larger image)

An Aruba Sensor “in the wild” at the University of Oklahoma library, part of a test deployment of the new hardware. Photo: Aruba (click on any photo for a larger image)

Stadiums and other large public venues that use any type of Wi-Fi hardware will now be able to use Aruba’s beacon-based apps and beacon management systems, thanks to a new “beacon sensor” introduced by Aruba today.

Part of a wide-ranging announcement heralding “version 2.0” or Aruba’s “mobile engagement” platform, the new beacon sensor — a $195 plug-into-the-wall device that can monitor and manage up to 10 nearby beacons — enables networks using any vendor’s Wi-Fi gear to utilize Aruba’s proven beacon software systems, which include the ability to support wayfinding apps. Prior to today’s announcement, only Aruba-based Wi-Fi networks could closely integrate with the Aruba beacon-based apps, a factor that limited market potential for Aruba’s beacon efforts. The new beacon sensors, Aruba said, also allow for cloud-based management of beacon deployments, which could save huge amounts of time by eliminating the need to physically visit or monitor each beacon in a network.

With the ability now to reach out to non-Aruba Wi-Fi customers, the former Aruba Networks — now formally known as “Aruba, a Hewlett Packard enterprise company” — also expanded its app developer partner program to target several different vertical markets where beacons might find a welcome home, like health care and retail/office situations. VenueNext, the developer of the Levi’s Stadium app — perhaps the poster child deployment of Aruba’s beacon offerings — is now a formal partner with Aruba, which may help VenueNext in its goal of bringing Levi’s Stadium app features like wayfinding maps to other stadiums, including those without Aruba-based Wi-Fi networks.

Aruba beacon at Levi's Stadium. Photo: Paul Kapustka, MSR

Aruba beacon at Levi’s Stadium. Photo: Paul Kapustka, MSR

Bringing beacon management to other networks

Jeff Hardison, director of product marketing for mobile engagement at Aruba, said the beacon sensor came out of internal questioning about how Aruba could help make beacons more mainstream, “and more useful.”

The solution is a small box, not much bigger than a beacon, which has inside both Bluetooth Low Energy (BLE) and Wi-Fi radios, allowing it to connect both to nearby beacons via Bluetooth and to Wi-Fi access points — importantly, Wi-Fi access points from any vendor. The devices, available for ordering today for $195 each, plug into standard electrical outlets and can manage about 9 to 10 beacons each, Hardison said, depending on proximity.

For VenueNext, the sensor could help the company more easily bring its beacon-based app features to stadiums and venues that don’t have Aruba Wi-Fi networks like Levi’s Stadium. Earlier this year, VenueNext had said it would announce 30 new venues using its apps by the end of the year, but so far it has identified only three new customers, the Orlando Magic, the New York Yankees and the Dallas Cowboys. The Cowboys, in particular, have a Cisco Wi-Fi network in AT&T Stadium, so it remains to be seen if Aruba beacon sensors will be used there to integrate the wayfinding feature in the AT&T Stadium app.

Screenshot of wayfinding features in Levi's Stadium app. Photo: Aruba

Screenshot of wayfinding features in Levi’s Stadium app. Photo: Aruba

Along with the sensors, with Aruba’s new beacon and sensor management system administrators can also manage beacons remotely, cutting down the time needed to visit each beacon in person to check battery life, software updates or other settings. As beacon deployments start to climb into the thousands per network, such remote management could be a huge time-saver, Hardison said. The beacon management system can also be used with the sensors in non-Aruba Wi-Fi deployments, Aruba said.

On beyond stadiums to libraries, hospitals, airports and more

While the Levi’s Stadium app’s wayfinding feature — which allows San Francisco 49ers fans to follow themselves as a blue dot walking through a map of the venue — is perhaps the most well-known Aruba beacon app, the Meridian platform (obtained by Aruba in a 2013 purchase of indoor Wi-Fi location company Meridian) is also being used to manage beacons at the Orlando International Airport, and is being trialed at the University of Oklahoma’s libraries, according to Aruba.

New software partners in the Aruba mobile engagement stable include Robin, which has a meeting room booking application, and companies with apps to help with navigation in hospitals and schools. The Meridian/Aruba beacon system was also previously used in apps at the Nebraska Furniture Mart and the American Museum of Natural History.

Stadium Tech Professionals: Time to take our 2015 stadium tech survey!

SOS14_thumbIf you are a stadium technology professional working for a school, team or stadium ownership group, it’s that time of year again — we need your participation to make our 2015 State of the Stadium Technology Survey our best yet! Now in its third year of existence, the “State of the Stadium” survey is the only independent, large-public-venue research that charts deployments of stadium technology like Wi-Fi, DAS, Digital Signage and Beaconing, and the use of digital sports marketing tools like CRM and social media. If you are part of a stadium operations group and know the answers, take the 2015 survey right now!

Before I get to a deeper explanation of the survey, a quick story: During last year’s survey season, I called a team IT exec that I knew well and asked why nobody from his organization had taken the survey. “Well, we don’t have Wi-Fi installed yet,” the exec said. “We’ll take the survey next year after it’s deployed.” I didn’t have the heart to say it at the time but — his take was completely the WRONG ANSWER. Why? Because this is an ANONYMOUS, AGGREGATED INFORMATION ONLY survey, which means that answers aren’t tied to any school, team or individual. Just look at last year’s survey to see how the answers are reported. That also means that all answers are completely confidential, and will not be sold, marketed or otherwise communicated in any way, shape or form outside of the ANONYMOUS TOTALS used in the survey report.

So since we’re trying to find out aggregate numbers — not individual details — it’s just as important for all of us to know who doesn’t have Wi-Fi as well as who does. So even if your school or team or stadium doesn’t have Wi-Fi — and may never have Wi-Fi — you should still TAKE THE SURVEY and add your organization’s information to the total. The more answers we get, the better the data are for everyone.

Survey time is time well spent

And that “everyone” thing leads me to my next point: If you’re a regular reader here you can and should consider the few minutes it takes to complete the survey as a small way of “paying back” to the rest of the members of this fine industry, many of whom make time for the interviews, visits and emails that form the core of all the excellent free content available here on the MSR site and through our long-form reports. We know you are busy, and that spending time answering a list of technology questions may not seem like the highest priority on your to-do list. But a little bit of your time can really help us all.

That’s because we also know, from our website statistics and from our report download numbers and just from conversations with many of you, that our audience of stadium technology professionals appreciates the honest, objective stories and analysis we provide. (We humbly thank you for making us a regular reading choice.) And now, by taking the survey, you can help make the site and our work even better, just by adding your team, school or stadium’s technology deployment information into the 2015 State of the Stadium Technology Survey. The more results we get, the better and more informative the survey becomes — and that’s something that’s truly a win-win situation for all involved.

Once again the State of the Stadium Technology Survey will be exclusively delivered first to the attendees of the SEAT Conference, being held this year in our home town of San Francisco, July 19-22. Production of this year’s survey is made possible by the sponsorship of Mobilitie, and through our partnership with the SEAT Consortium, owners and operators of the excellent SEAT event. All those who participate in the survey will receive a full digital copy of the final report, whether you attend the SEAT Conference or not.

Final reminder: This survey is meant to be taken ONLY by stadium technology professionals, executives, and team or school representatives who can accurately describe the deployments in place at their organization. It is NOT a survey to be taken by everyone, only by those who have a deployment to describe. If you have any questions about whether you should take the survey or not, send an email to me at kaps at mobilesportsreport.com. Thanks in advance for your time and participation!

https://duwit.ukdw.ac.id/document/pengadaan/slot777/

https://mtsnupakis.sch.id/wp-content/zeusslot/

https://insankamilsidoarjo.sch.id/wp-content/slot-zeus/

https://smpbhayangkari1sby.sch.id/wp-content/slot-zeus/

https://alhikamsurabaya.sch.id/wp-content/slot-thailand/

https://mtsnupakis.sch.id/wp-content/bonus-new-member/

https://smptagsby.sch.id/wp-content/slot-bet-200/

https://lookahindonesia.com/wp-content/bonus-new-member/

https://ponpesalkhairattanjungselor.sch.id/wp-content/mahjong-slot/

https://mtsnupakis.sch.id/wp-content/slot777/

https://sdlabum.sch.id/wp-content/slot777/

https://sdlabumblitar.sch.id/wp-content/bonus-new-member/

https://sdlabumblitar.sch.id/wp-content/spaceman/

https://paudlabumblitar.sch.id/wp-content/spaceman/